
The Alfa Romeo Stelvio
Here you will find Canadian, European and U.S. sales figures for the Alfa Romeo Stelvio. The Alfa Romeo Stelvio is a mid-size luxury SUV that was introduced in 2016. It is the first SUV produced by Alfa Romeo, and it is based on the Giulia sedan. The Stelvio is Alfa Romeo’s premium SUV that competes against the Jaguar F-Pace, Audi Q5, and Mercedes GLC . It was premiered in June 2016, with market launch in January 2018. The name Stelvio derives from the Stelvio Pass, Italy’s highest mountain pass, noted for its 48 circuitous switchbacks
Alfa Romeo Stelvio Overview
The Alfa Romeo Stelvio is a luxury compact crossover SUV produced by the Italian automaker Alfa Romeo. It was first introduced in 2016 and is named after the Stelvio Pass, one of the highest and most famous mountain passes in the Italian Alps. The Stelvio was designed to combine the performance and driving dynamics of a sports sedan with the versatility and practicality of an SUV, making it an attractive option for those seeking a premium and sporty crossover.
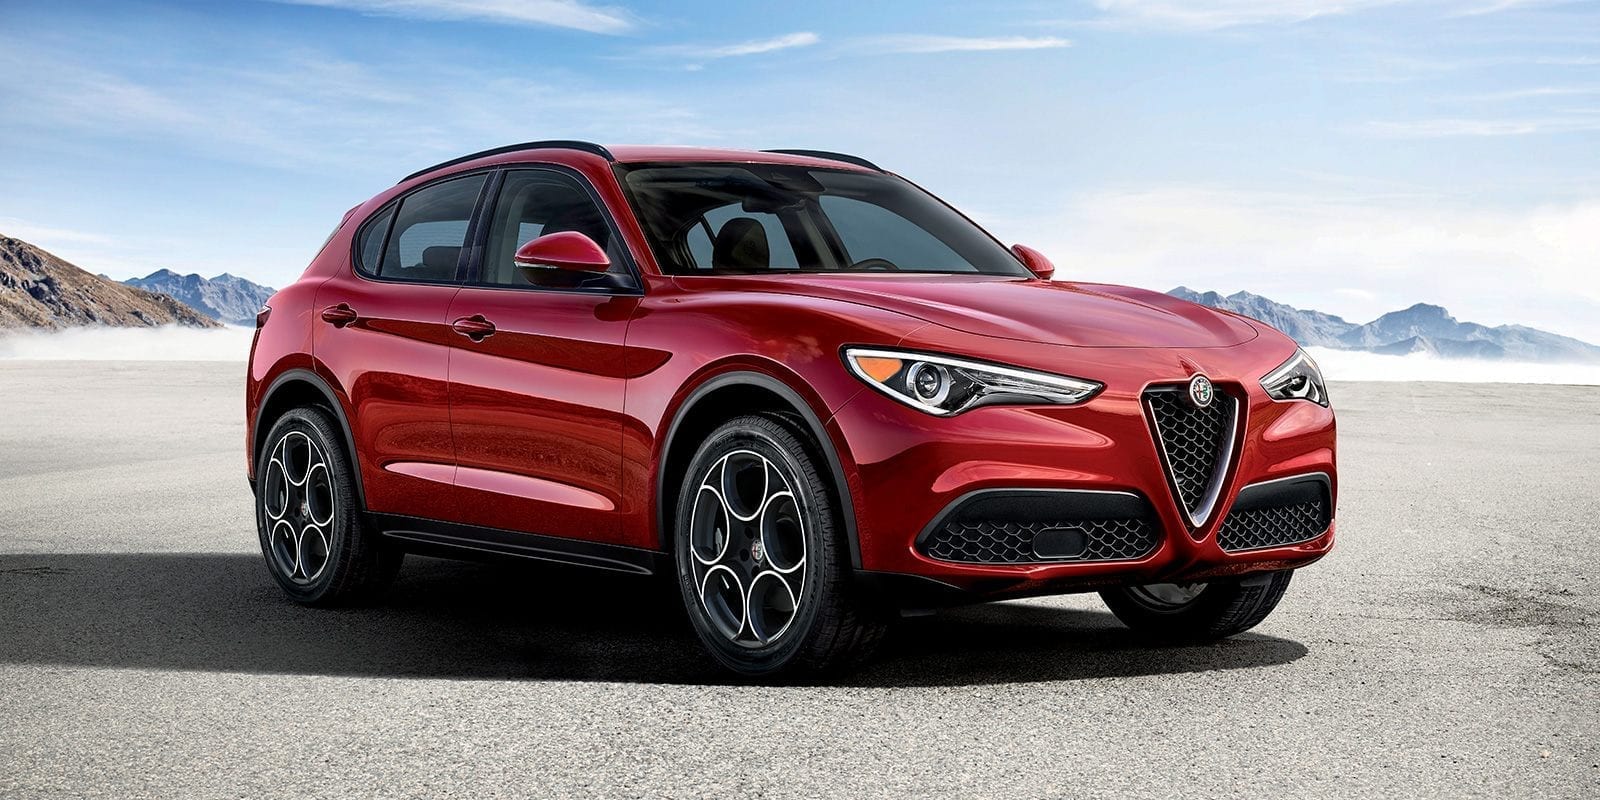
The Alfa Romeo Stelvio features a distinctive and stylish design, reflecting Alfa Romeo’s iconic styling cues. It has a sleek and aerodynamic profile with muscular fenders and a sporty stance. The front end is characterized by the classic Alfa Romeo grille and angular headlights, while the rear showcases a sculpted tailgate and dual exhausts.
The Stelvio is available with two engine options: a 2.0-liter turbocharged four-cylinder engine that produces 280 horsepower and 306 pound-feet of torque, and a 2.9-liter twin-turbocharged V6 engine that produces 505 horsepower and 443 pound-feet of torque. Both engines are mated to an eight-speed automatic transmission. The Stelvio is a very capable SUV. It has a 0-60 mph time of 5.1 seconds for the base engine and 3.9 seconds for the Quadrifoglio model. It also has a top speed of 155 mph for the base engine and 177 mph for the Quadrifoglio model.
Alfa Romeo Stelvio Sales Data & Trends
The Alfa Romeo Stelvio has received praise from automotive enthusiasts and reviewers for its blend of performance, style, and luxury. Its combination of Italian flair and practicality has earned it recognition as a standout option in the luxury compact crossover SUV segment. Sales have been strong in Europe, the U.S and Canada, but it is still not seeing the sales success that Alfa Romeo expected (or that the reviews suggested).
Alfa Romeo Stelvio U.S Sales Data & Charts
Below we have the sales figures for the Alfa Romeo Stelvio in the American automotive market. This data comes from the manufacturer directly. View the data tables of the total number of new Alfa Romeo Stelvio vehicles sold in the United States in a given month and year.
U.S Monthly Sales
U.S Annual Sales
| Year | Sales Units |
|---|
U.S Annual Growth
Alfa Romeo Stelvio Canada Sales Data & Charts
Below we have the sales figures for the Alfa Romeo Stelvio in the Canadian automotive market. This data comes from the manufacturer directly. View the data tables of the total number of new Alfa Romeo Stelvio vehicles sold in the Canada in a given month and year.
Canada Annual Sales
Year Sales Units
Canada Annual Growth
Alfa Romeo Stelvio Europe Sales Data & Charts
Below we have the sales figures for the Alfa Romeo Stelvio in the European automotive market. This data comes from the manufacturer directly. View the data tables of the total number of new Alfa Romeo Stelvio vehicles sold in the U.S. in a given month and year.
Europe Annual Sales
| Year | Sales Units |
|---|


Nice numbers,but you need to do better.