2014 Europe Auto Sales Figures – By Model (All Vehicle Ranked)
2014 European Vehicle Sales Rankings – Every Vehicle Ranked By Sales Volume
After discussing the full year 2014 European car brands ranking, let’s see which models have fueled their respective brands’ success or failure. In the top-10, the Golf naturally reigns supreme, and with 61,000 additional sales, it adds “a Citroën C4” to its sales volume compared to 2013. It’s still followed by four subcompacts, of which the Fiesta, Clio and Polo have stayed very close together, each adding between 14,700 and 15,900 sales last year, as the Corsa falls behind a bit. But so does the Peugeot 208, the biggest loser in the top-10.
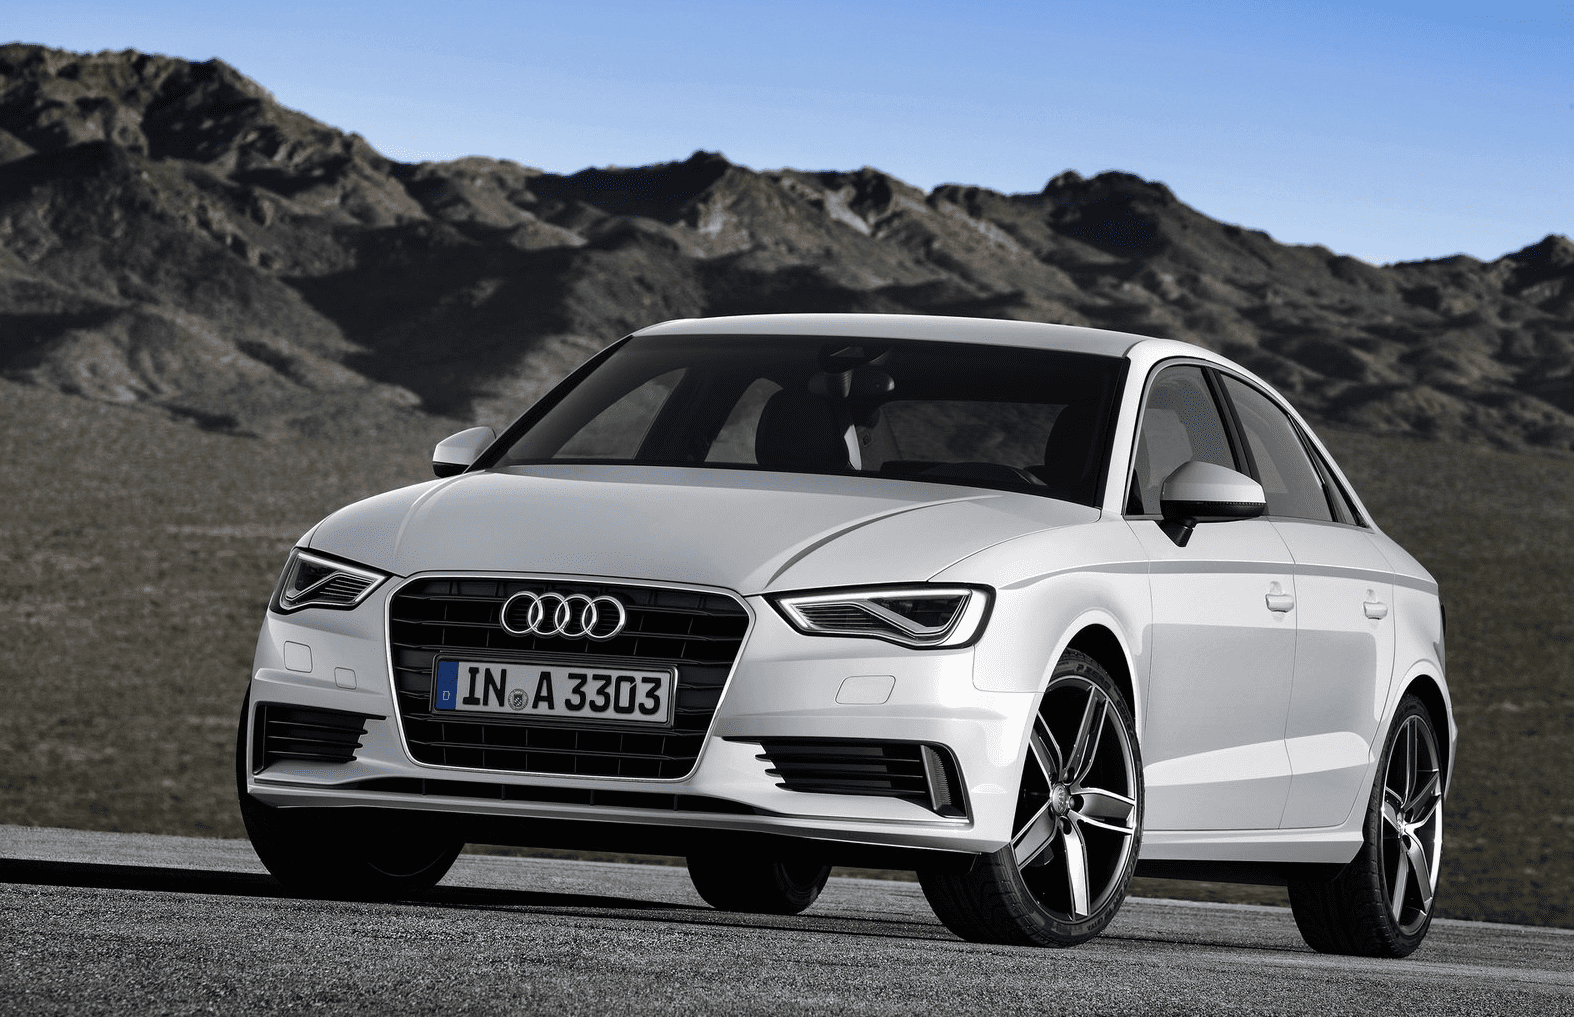
The Skoda Octavia has its best sales in Europe ever and together with the Audi A3 it kicks the Opel/Vauxhall Astra and BMW 3-series out of the top-10, while the Nissan Qashqai enjoys its fifth straight year with over 200,000 sales. The Astra on the other hand has its worst year ever, down another 9.5% after dipping below 200,000 sales for the first time last year. The Opel/Vauxhall compact is now threatened by the Peugeot 308, which looks set to outsell the Astra for the very first time ever, although its predecessor 307 has done this as well from 2002 till 2004.

 In the top-10, the Golf naturally reigns supreme, and with 61,000 additional sales, it adds “a Citroën C4” to its sales volume compared to 2013. It’s still followed by four subcompacts, of which the Fiesta, Clio and Polo have stayed very close together, each adding between 14,700 and 15,900 sales last year, as the Corsa falls behind a bit. But so does the Peugeot 208, the biggest loser in the top-10.


