2019 European Automotive Sales by Brand – The Best-Selling Automotive Brands By Sales Volume
After discussing European car sales in 2019 by manufacturer, let’s zoom in on sales at brand level. Volkswagen and Renault are the only brands to sell over a million cars in Europe, while Ford dips below that number. VW sets a new annual sales record in Europe at nearly 1.76 million deliveries, up 2.3% over 2018 and increasing its share to 11.2%. Peugeot improves 0.6% to close in on the #3 spot with just 23,000 sales between Ford and itself.
Mercedes-Benz is the big winner in the brands top-7 at +3.3%, the second time ever above 900,000 sales and its highest annual sales in Europe ever. Its rival BMW is up just 0.9% but also sets a new annual sales record in Europe, while Opel/Vauxhall struggles after the PSA takeover as the French are culling models that are not (yet) based on their own platforms and still rely on GM technology. Opel/Vauxhall is down 8% to just over 800,000 sales, a record low for the brand.
Meanwhile, Skoda leapfrogs Audi thanks to a 6.5% gain in not only its 7th consecutive year of growth, but also its 7th consecutive annual sales record in Europe, growing from 489,500 sales in 2012 to over 745,300 in 2019. Toyota consolidates its top-10 position with a 4.5% gain, its 6th consecutive year of improved sales but still below the brand’s record of nearly 900,000 sales in 2007, while Fiat is down 9.7% to just 4% share. Only from 2012 to 2014 did Fiat sell fewer vehicles in Europe, while it sold double of its current annual sales in 1997.
Citroën is up 6.2% in its third straight year of improvements, keeping Dacia at bay. Like Skoda, the Romanian brand scored not only its 7th consecutive year of growth, but also its 7th consecutive annual sales record in Europe, more than doulbing its 238,000 sales in 2012 to over 576,500 in 2019. For Hyundai, 2019 marks the 6th consecutive year of growth in Europe, of which the 5th consecutive annual sales record, while sister brand Kia has broken its 8-year long winning streak with a slight 0.1% decline in 2019.
The worst performer in the top-30 brands ranking by far is Nissan with an 18.9% decline to its lowest annual sales volume since 2010 as its best selling models Qashqai and Juke are due for a redesign in 2020. That has allowed Seat to leapfrog both Kia and Nissan to take 15th place thanks to a 13.7% gain in the Spanish brand’s 7th consecutive year of growth but only its second consecutive annual sales record.
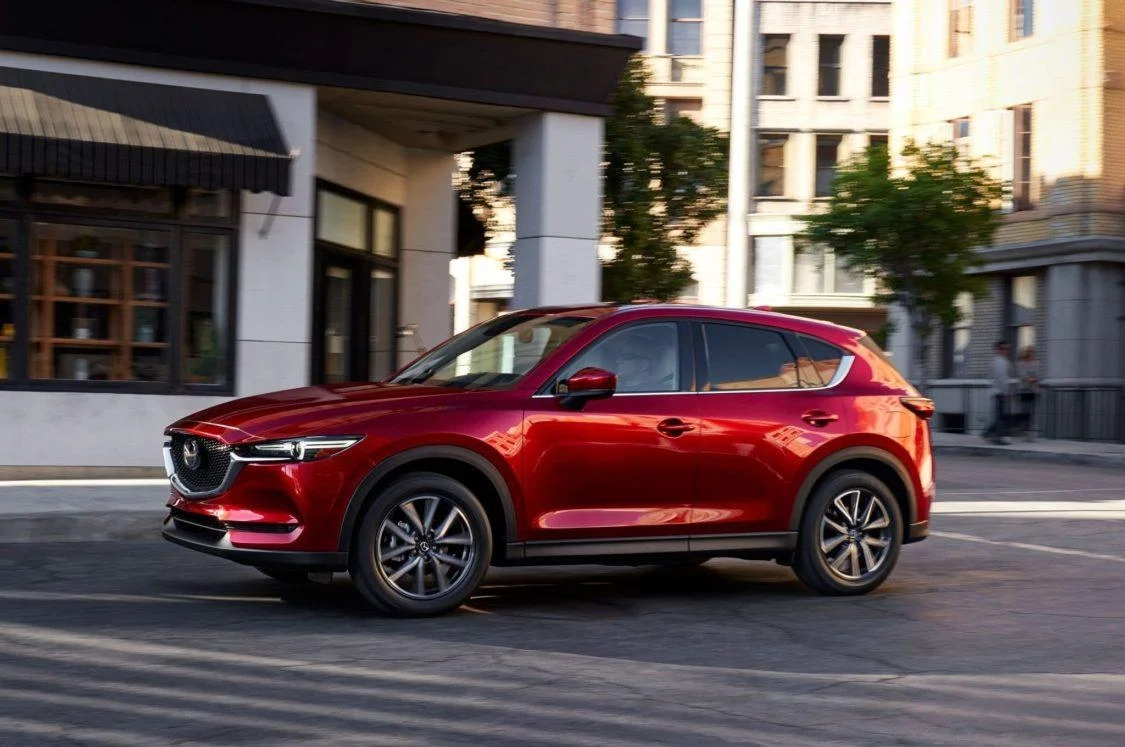
Chinese-owned Swedish brand Volvo celebrates its 6th straight year of growth and its 5th annual sales record, while Suzuki is also up for the 6th year in a row but still below its record of 285,500 sales in 2007. Mazda sales are up to the highest annual volume since 2007 but the Japanese brand sold even better in Europe in the early 1990s. Mini and Jeep both break their 5-year winning streaks and 4-year annual sales records streak with respectively a 0.8% and a 1.1% decline in 2019. After peaking in 2017, Land Rover is down for the second year in a row while Mitsubishi is up to its highest European annual sales since 2005 but still far below its peak above 200,000 sales in 1999. Smart is up 17.6% to its highest annual sales since 2006 just before it is turning into an all-electric brand in 2020. But while this may look like an excellent performance, the caveat is that 24.9% of its full year 2019 sales were registered in the last two months of the year, with December 2019 being an all-time best month for the brand, because of self-registrations of its gasoline-powered models before 2020.
Porsche enjoys a 6th consecutive year of growth and its 6th consecutive annual sales record in Europe, growing from 44,500 sales in 2013 to 77,500 sales in 2019. In contrast, Jaguar has ended its 7-year winning streak and its 3-year record streak in 2019 with an 8.9% decline. Lancia on the other hand is back up 21% after hitting an all-time low in 2018, which allows it to leapfrog sister brand Alfa Romeo which is down 34.8% to its lowest annual sales ever.
Lexus outsells Alfa Romeo in Europe for the first time ever as the Japanese luxury brand continues a 6-year winning streak and sets a 4th straight European sales record with sales up nearly 21% in 2019. Alfa even almost falls behind French upstart rival DS, up 16.2% after hitting its lowest annual sales ever. Maserati is facing the same fate as its Italian sister brand, down to its lowest annual sales since 2013 when the Ghibli was reintroduced.
Alpine more than doubles up on its introduction year and smashes its annual sales record from 1972, outselling its main rival Porsche Cayman, but its success is slightly one-sided as Alpine is for 71.9% dependent on its home market France. Ferrari and Bentley both outpace the market in 2019 with high one-digit increases where the Italian sports car brand sets a new annual sales record. Italian-Chinese DR Motor improves its 2018 sales by a factor of more than 2.5 and has expanded beyond its home market to sell 88 units in Spain, but remains below its peak of over 5,000 sales in 2010.
2019 Best Selling Car Brands In Europe
This data table looks at last month’s total automotive brand volumes in Europe by model. We compare European automotive brand sales with last year. With these sales numbers we also calculate a growth rate column so you can better gauge an individual automotive brands sales success in the Canadian market.
| Brand | Month | LY | Change | YTD | YTD Last Year | YTD Change | Month Share | YTD Share |
|---|---|---|---|---|---|---|---|---|
| Alfa Romeo | 54,358 | 83,425 | -34.84 | 54,358 | 83,425 | -34.84 | 3.38 | 0.32 |
| Alpine | 4,376 | 195 | 2,144.10 | 4,376 | 195 | 2,144.10 | 0.27 | 0.03 |
| Aston Martin | 2,509 | 1,751 | 43.29 | 2,509 | 1,751 | 43.29 | 0.16 | 0.01 |
| Audi | 740,651 | 712,374 | 3.97 | 740,651 | 712,374 | 3.97 | 46.12 | 4.30 |
| Bentley | 3,299 | 3,086 | 6.90 | 3,299 | 3,086 | 6.90 | 0.21 | 0.02 |
| BMW | 812,800 | 814,791 | -0.24 | 812,800 | 814,791 | -0.24 | 50.61 | 4.71 |
| Cadillac | 445 | 906 | -50.88 | 445 | 906 | -50.88 | 0.03 | 0.00 |
| Chevrolet | 2,382 | 2,337 | 1.93 | 2,382 | 2,337 | 1.93 | 0.15 | 0.01 |
| Chrysler | 117 | 151 | -22.52 | 117 | 151 | -22.52 | 0.01 | 0.00 |
| Citroen | 625,817 | 587,719 | 6.48 | 625,817 | 587,719 | 6.48 | 38.97 | 3.63 |
| Dacia | 576,436 | 522,781 | 10.26 | 576,436 | 522,781 | 10.26 | 35.89 | 3.34 |
| Dodge | 1,247 | 1,397 | -10.74 | 1,247 | 1,397 | -10.74 | 0.08 | 0.01 |
| DR Motor | 3,864 | 1,467 | 163.39 | 3,864 | 1,467 | 163.39 | 0.24 | 0.02 |
| DS | 52,597 | 45,251 | 16.23 | 52,597 | 45,251 | 16.23 | 3.28 | 0.31 |
| Ferrari | 3,608 | 3,332 | 8.28 | 3,608 | 3,332 | 8.28 | 0.22 | 0.02 |
| Fiat | 794,343 | 897,411 | -11.49 | 794,343 | 897,411 | -11.49 | 49.46 | 4.61 |
| Ford | 903,229 | 947,674 | -4.69 | 903,229 | 947,674 | -4.69 | 56.24 | 5.24 |
| Honda | 101,185 | 109,792 | -7.84 | 101,185 | 109,792 | -7.84 | 6.30 | 0.59 |
| Hyundai | 468,720 | 451,322 | 3.85 | 468,720 | 451,322 | 3.85 | 29.19 | 2.72 |
| Infiniti | 2,666 | 5,874 | -54.61 | 2,666 | 5,874 | -54.61 | 0.17 | 0.02 |
| Jaguar | 76,695 | 84,219 | -8.93 | 76,695 | 84,219 | -8.93 | 4.78 | 0.44 |
| Jeep | 163,122 | 165,035 | -1.16 | 163,122 | 165,035 | -1.16 | 10.16 | 0.95 |
| Kia | 497,954 | 488,431 | 1.95 | 497,954 | 488,431 | 1.95 | 31.01 | 2.89 |
| Lada | 4,715 | 4,358 | 8.19 | 4,715 | 4,358 | 8.19 | 0.29 | 0.03 |
| Lamborghini | 2,113 | 1,616 | 30.75 | 2,113 | 1,616 | 30.75 | 0.13 | 0.01 |
| Lancia | 117,640 | 97,234 | 20.99 | 117,640 | 97,234 | 20.99 | 7.33 | 0.68 |
| Land Rover | 122,809 | 121,257 | 1.28 | 122,809 | 121,257 | 1.28 | 7.65 | 0.71 |
| Lexus | 55,770 | 45,918 | 21.46 | 55,770 | 45,918 | 21.46 | 3.47 | 0.32 |
| Lotus | 664 | 714 | -7.00 | 664 | 714 | -7.00 | 0.04 | 0.00 |
| Maserati | 2,368 | 3,544 | -33.18 | 2,368 | 3,544 | -33.18 | 0.15 | 0.01 |
| Mazda | 298,750 | 292,426 | 2.16 | 298,750 | 292,426 | 2.16 | 18.60 | 1.73 |
| McLaren | 721 | 484 | 48.97 | 721 | 484 | 48.97 | 0.04 | 0.00 |
| Mercedes-Benz | 850,752 | 823,025 | 3.37 | 850,752 | 823,025 | 3.37 | 52.97 | 4.93 |
| MG | 14,058 | 9,049 | 55.35 | 14,058 | 9,049 | 55.35 | 0.88 | 0.08 |
| Mini | 80,562 | 81,641 | -1.32 | 80,562 | 81,641 | -1.32 | 5.02 | 0.47 |
| Mitsubishi | 171,114 | 165,296 | 3.52 | 171,114 | 165,296 | 3.52 | 10.65 | 0.99 |
| Nissan | 426,560 | 525,530 | -18.83 | 426,560 | 525,530 | -18.83 | 26.56 | 2.47 |
| Opel | 668,046 | 719,601 | -7.16 | 668,046 | 719,601 | -7.16 | 41.60 | 3.87 |
| Peugeot | 967,861 | 960,329 | 0.78 | 967,861 | 960,329 | 0.78 | 60.27 | 5.61 |
| Porsche | 77,543 | 67,882 | 14.23 | 77,543 | 67,882 | 14.23 | 4.83 | 0.45 |
| Renault | 1,056,644 | 1,081,750 | -2.32 | 1,056,644 | 1,081,750 | -2.32 | 65.79 | 6.13 |
| Rolls Royce | 820 | 702 | 16.81 | 820 | 702 | 16.81 | 0.05 | 0.00 |
| Seat | 504,585 | 238,426 | 111.63 | 504,585 | 238,426 | 111.63 | 31.42 | 2.93 |
| Skoda | 673,859 | 624,188 | 7.96 | 673,859 | 624,188 | 7.96 | 41.96 | 3.91 |
| Smart | 115,182 | 98,555 | 16.87 | 115,182 | 98,555 | 16.87 | 7.17 | 0.67 |
| Soueast | 10,325 | 12,051 | -14.32 | 10,325 | 12,051 | -14.32 | 0.64 | 0.06 |
| Subaru | 42,296 | 51,302 | -17.55 | 42,296 | 51,302 | -17.55 | 2.63 | 0.25 |
| Suzuki | 178,429 | 177,809 | 0.35 | 178,429 | 177,809 | 0.35 | 11.11 | 1.03 |
| SWM Motor | 32,064 | 23,095 | 38.84 | 32,064 | 23,095 | 38.84 | 2.00 | 0.19 |
| Tesla | 111,664 | 29,494 | 278.60 | 111,664 | 29,494 | 278.60 | 6.95 | 0.65 |
| Toyota | 722,415 | 700,935 | 3.06 | 722,415 | 700,935 | 3.06 | 44.98 | 4.19 |
| Volkswagen | 1,303,894 | 1,217,520 | 7.09 | 1,303,894 | 1,217,520 | 7.09 | 81.19 | 7.56 |
| Volvo | 241,579 | 219,401 | 10.11 | 241,579 | 219,401 | 10.11 | 15.04 | 1.40 |
| ∑ = 14,748,222 | ∑ = 14,325,853 | ∑ = 14,748,222 | ∑ = 14,325,853 |
2019 Auto Brand Market Share Dynamics in Europe
This data table looks at total automotive sales and specific brand volumes in Europe. We compare European automotive brand sales with last year. You can see the market share breakout visually for all the automotive brands selling in Europe.
2019 vs 2018 Auto Brand Sales in Europe
This chart simply takes each brand and compares their year to date sales with the year to date sales for the same time last year. Brands where the current bar is lower than the prior year bar have seen declines in sales year on year whereas brands with a larger current bar and lower prior bar are seeing growth in volumes year on year.
2019 Automotive Brand Sales Analysis
This chart might seem a little complicated at first but once you understand it is very helpful. First, the size of the area for each brand refers to their market share (i.e size). The bigger the circle the larger the brand in terms of sales volumes (YTD). The position of the circle in the chart along the left axis looks at the year to date growth of that brand. The higher the brand is on the chart, the more year to date growth it is seeing in sales volumes. Along the bottom axis you can see the total volumes shipped by that brand year to date.
European car sales statistics are from the following countries: Austria, Belgium, Bulgaria, Croatia, Cyprus, Czech Republic, Denmark, Estonia, Finland, France, Germany, Greece, Hungary, Iceland, Ireland, Italy, Latvia, Lithuania, Luxembourg, Netherlands, Norway, Poland, Portugal, Romania, Slovakia, Slovenia, Spain, Sweden, Switzerland, United Kingdom. They exclude vehicles registered as commercial vehicles.
Source: ANDC, JATO Dynamics