
2021 European Vehicle Sales Rankings – Every Vehicle Ranked By Sales Volume
After looking at the manufacturers and brands rankings for 2021, let’s take a deeper look at car sales by model in Europe. The traditional leader Volkswagen Golf has been under heavy pressure this year, taking only 4 monthly wins and losing almost a quarter of its sales on last year. The Golf does manage to hold on to its crown for the 14th consecutive year. There’s a fierce battle for 2nd place with four models within 10,000 deliveries of each other.
The Renault Clio holds on to the 2nd place it’s held since 2016 despite sales down 19.6%, while the Peugeot 208 is down 1.8% into third place, just ahead of the Dacia Sandero, up 15.8%. Best selling crossover is the Peugeot 2008 at #5 with sales up 22.6% to a new annual record for the nameplate, outselling the Volkswagen T-Roc, up 14.5% to #7 and the Renault Captur, down 9.3% at #10. The Opel/Vauxhall Crosa drops 2 places to #6 while the Toyota Yaris, which started the year strong, is down 1% and also loses 2 places. Thanks to the all-new EV version and a hybrid version, the Fiat 500 is up 24.5% to reenter the top-10 at #9.
Best selling luxury vehicle is the Tesla Model 3 at #17, ahead of the Volvo XC40 at #23, the Mercedes-Benz A-Class at #24, the BMW 3-Series at #27 and the BMW 1-Series at #34. The Model 3 is also the best selling EV, ahead of the Volkswagen ID.3 at #53, the Renault Zoe at #56 and the Volkswagen ID.4 at #84.
Big winners in the top-100 are the Opel/Vauxhall Mokka at #54, the Citroën C4 at #60, Tesla Model 3 at #17 (+63.8%), Hyundai Tucson (+58.8% to #15), Ford Kuga (+34.7% to #29) and Mercedes-Benz GLA and EQA (+34.4% to #49). Big losers in the top-100 are the Ford Fiesta (-44.6% to #40), Ford Focus (-41.9% to #32), Peugeot 308 (-40.9% to #85), Mercedes-Benz C-Class (-30.5% to #73) and Renault Zoe (-30.5%).
We see record annual sales for the Peugeot 2008 (#5), Tesla Model 3 (#17), Ford Puma (#19), Volkswagen T-Cross (#22), Volvo XC40 (#24), Audi Q3 (#36), Kia Niro (#38), Skoda Kamiq (#45), BMW X3 (#46), Mercedes-Benz GLA (#49), Volkswagen ID.3 (#53), Mazda CX-30 (#92), Mercedes-Benz GLB (#111) and MG ZS (#124).
Newcomer Models
Best selling newcomers are the Renault Arkana at #104, Tesla Model Y (#129), Toyota Yaris Cross (#131), Hyundai Ioniq 5 (#153), Audi Q4 (#163), Hyundai Bayon (#174), Kia EV6 (#211), Lynk & Co (#212), Audi e-Tron GT (#245), BMW IX (#254) and Audi Q4 Sportback (#261). We also welcome the DS 9 at #280, Volkswagen Taigo (#283), Volvo C40 (#298), BYD Tang (#301), Mercedes-Benz EQS (#302) and MG Marvel R (#312).
2021 European Vehicle Sales by Model
This sales data table looks at sales performance for every model sold in Europe for the entire year. It includes all major models sold in the European market and you can see that the sales trends clearly. Seeing the individual model sales performance in this way gives you a good sense of the momentum (good or bad).
| Model | Month | Month LY | Change | YTD | YTD LY | YTD Change |
|---|---|---|---|---|---|---|
| Lynk and Co 01 | 7,917 | 0 | 0.00 | 7,917 | 0 | 0.00 |
| BMW 1-Series | 96,410 | 107,870 | -10.62 | 96,410 | 107,870 | -10.62 |
| Peugeot 108 | 34,689 | 43,629 | -20.49 | 34,689 | 43,629 | -20.49 |
| Mazda 2 | 18,339 | 16,402 | 11.81 | 18,339 | 16,402 | 11.81 |
| BMW 2-Series | 34,852 | 32,613 | 6.87 | 34,852 | 32,613 | 6.87 |
| BMW 2-Series Active Tourer | 18,487 | 30,482 | -39.35 | 18,487 | 30,482 | -39.35 |
| Peugeot 2008 | 191,424 | 156,138 | 22.60 | 191,424 | 156,138 | 22.60 |
| Peugeot 208 | 195,728 | 199,316 | -1.80 | 195,728 | 199,316 | -1.80 |
| Mazda 3 | 22,554 | 29,005 | -22.24 | 24,572 | 29,005 | -15.28 |
| MG 3 | 2,018 | 29,005 | -93.04 | 24,572 | 29,005 | -15.28 |
| BMW 3-Series | 113,209 | 118,369 | -4.36 | 113,209 | 118,369 | -4.36 |
| Peugeot 3008 | 139,628 | 125,440 | 11.31 | 139,628 | 125,440 | 11.31 |
| Peugeot 301 | 574 | 600 | -4.33 | 574 | 600 | -4.33 |
| Peugeot 308 | 53,356 | 90,324 | -40.93 | 53,356 | 90,324 | -40.93 |
| Nissan 370Z | 18 | 324 | -94.44 | 18 | 324 | -94.44 |
| BMW 4-Series | 33,083 | 18,139 | 82.39 | 33,083 | 18,139 | 82.39 |
| Ferrari 488 | 152 | 1,207 | -87.41 | 152 | 1,207 | -87.41 |
| BMW 5-Series | 52,936 | 59,814 | -11.50 | 52,936 | 59,814 | -11.50 |
| Fiat 500 | 175,950 | 141,313 | 24.51 | 175,950 | 141,313 | 24.51 |
| Peugeot 5008 | 53,119 | 54,468 | -2.48 | 53,119 | 54,468 | -2.48 |
| Fiat 500L | 19,967 | 21,883 | -8.76 | 19,967 | 21,883 | -8.76 |
| Fiat 500X | 53,826 | 58,853 | -8.54 | 53,826 | 58,853 | -8.54 |
| Peugeot 508 | 25,202 | 29,011 | -13.13 | 25,202 | 29,011 | -13.13 |
| Mazda 6 | 4,890 | 6,950 | -29.64 | 4,890 | 6,950 | -29.64 |
| BMW 6-Series | 1,231 | 2,060 | -40.24 | 1,231 | 2,060 | -40.24 |
| Volvo 60-Series | 4,521 | 7,200 | -37.21 | 4,521 | 7,200 | -37.21 |
| BMW 7-Series | 5,235 | 6,346 | -17.51 | 5,235 | 6,346 | -17.51 |
| Porsche 718 | 5,667 | 6,663 | -14.95 | 5,667 | 6,663 | -14.95 |
| Ferrari 812 Superfast | 812 | 975 | -16.72 | 812 | 975 | -16.72 |
| Volvo 90-Series | 16,645 | 23,578 | -29.40 | 16,645 | 23,578 | -29.40 |
| Porsche 911 | 15,705 | 15,340 | 2.38 | 15,705 | 15,340 | 2.38 |
| Mercedes-Benz A-Class | 118,439 | 158,955 | -25.49 | 118,439 | 158,955 | -25.49 |
| Audi A1 | 57,092 | 58,224 | -1.94 | 57,092 | 58,224 | -1.94 |
| Alpine A110 | 2,427 | 1,343 | 80.71 | 2,427 | 1,343 | 80.71 |
| Audi A3 | 95,788 | 97,492 | -1.75 | 95,788 | 97,492 | -1.75 |
| Audi A4 | 59,251 | 77,515 | -23.56 | 59,251 | 77,515 | -23.56 |
| Audi A5 | 26,100 | 28,525 | -8.50 | 26,100 | 28,525 | -8.50 |
| Audi A6 | 50,238 | 55,737 | -9.87 | 50,238 | 55,737 | -9.87 |
| Audi A7 | 4,260 | 5,807 | -26.64 | 4,260 | 5,807 | -26.64 |
| Audi A8 | 2,865 | 3,648 | -21.46 | 2,865 | 3,648 | -21.46 |
| Suzuki Across | 2,179 | 1,953 | 11.57 | 2,179 | 1,953 | 11.57 |
| Seat Alhambra | 5,341 | 15,179 | -64.81 | 5,341 | 15,179 | -64.81 |
| Mercedes-Benz AMG GT | 2,266 | 3,640 | -37.75 | 2,266 | 3,640 | -37.75 |
| Opel Ampera-e | 115 | 2,775 | -95.86 | 115 | 2,775 | -95.86 |
| Renault Arkana | 40,847 | 0 | 0.00 | 40,847 | 0 | 0.00 |
| Seat Arona | 84,984 | 80,765 | 5.22 | 84,984 | 80,765 | 5.22 |
| Volkswagen Arteon | 20,994 | 13,582 | 54.57 | 20,994 | 13,582 | 54.57 |
| Opel Astra | 14,307 | 13,176 | 8.58 | 14,307 | 13,176 | 8.58 |
| Mitsubishi ASX | 6,271 | 17,983 | -65.13 | 6,271 | 17,983 | -65.13 |
| Seat Ateca | 62,449 | 70,408 | -11.30 | 62,449 | 70,408 | -11.30 |
| Lamborghini Aventador | 292 | 357 | -18.21 | 292 | 357 | -18.21 |
| Toyota Aygo | 82,820 | 82,711 | 0.13 | 82,820 | 82,711 | 0.13 |
| Mercedes-Benz B-Class | 27,694 | 44,664 | -37.99 | 27,694 | 44,664 | -37.99 |
| Hyundai Bayon | 15,404 | 0 | 0.00 | 15,404 | 0 | 0.00 |
| Bentley Bentayga | 1,180 | 975 | 21.03 | 1,180 | 975 | 21.03 |
| Citroen Berlingo Multispace | 29,917 | 35,197 | -15.00 | 29,917 | 35,197 | -15.00 |
| Peugeot Boxer Tepee | 1,403 | 0 | 0.00 | 1,403 | 0 | 0.00 |
| Subaru BRZ | 160 | 323 | -50.46 | 160 | 323 | -50.46 |
| Mercedes-Benz C-Class | 56,927 | 81,909 | -30.50 | 56,927 | 81,909 | -30.50 |
| Citroen C-Elysee | 901 | 278 | 224.10 | 901 | 278 | 224.10 |
| Toyota C-HR | 106,251 | 101,252 | 4.94 | 106,251 | 101,252 | 4.94 |
| Citroen C1 | 35,897 | 40,578 | -11.54 | 35,897 | 40,578 | -11.54 |
| Citroen C3 | 156,904 | 149,284 | 5.10 | 156,904 | 149,284 | 5.10 |
| Citroen C3 Aircross | 68,608 | 75,281 | -8.86 | 68,608 | 75,281 | -8.86 |
| Citroen C4 | 64,982 | 3,441 | 1,788.46 | 64,982 | 3,441 | 1,788.46 |
| Citroen C4 Cactus | 1,192 | 26,379 | -95.48 | 1,192 | 26,379 | -95.48 |
| Citroen C4 Picasso | 16,826 | 26,717 | -37.02 | 16,826 | 26,717 | -37.02 |
| Citroen C5 Aircross | 54,346 | 69,750 | -22.08 | 54,346 | 69,750 | -22.08 |
| Citroen C5 X | 63 | 0 | 0.00 | 63 | 0 | 0.00 |
| Volkswagen Caddy Life | 32,836 | 41,855 | -21.55 | 32,836 | 41,855 | -21.55 |
| Chevrolet Camaro | 241 | 121 | 99.17 | 241 | 121 | 99.17 |
| Toyota Camry | 8,222 | 9,119 | -9.84 | 8,222 | 9,119 | -9.84 |
| Renault Captur | 162,138 | 178,724 | -9.28 | 162,138 | 178,724 | -9.28 |
| Porsche Cayenne | 16,310 | 18,330 | -11.02 | 16,310 | 18,330 | -11.02 |
| Kia Ceed | 80,057 | 72,017 | 11.16 | 80,057 | 72,017 | 11.16 |
| Suzuki Celerio | 16 | 2,035 | -99.21 | 16 | 2,035 | -99.21 |
| Dodge Challenger | 351 | 0 | 0.00 | 351 | 0 | 0.00 |
| Dodge Charger | 181 | 0 | 0.00 | 181 | 0 | 0.00 |
| Jeep Cherokee | 339 | 2,237 | -84.85 | 339 | 2,237 | -84.85 |
| Mercedes-Benz Citan Tourer | 327 | 0 | 0.00 | 327 | 0 | 0.00 |
| Skoda Citigo | 5,264 | 14,120 | -62.72 | 5,264 | 14,120 | -62.72 |
| Honda Civic | 14,417 | 17,282 | -16.58 | 14,417 | 17,282 | -16.58 |
| Mercedes-Benz CLA-Class | 55,956 | 67,319 | -16.88 | 55,956 | 67,319 | -16.88 |
| Renault Clio | 199,889 | 248,602 | -19.59 | 199,889 | 248,602 | -19.59 |
| Mercedes-Benz CLS-Class | 2,155 | 3,895 | -44.67 | 2,155 | 3,895 | -44.67 |
| Opel Combo Tour | 183,495 | 198,887 | -7.74 | 183,495 | 198,887 | -7.74 |
| Jeep Compass | 54,738 | 47,312 | 15.70 | 54,738 | 47,312 | 15.70 |
| Bentley Continental GT | 1,207 | 1,462 | -17.44 | 1,207 | 1,462 | -17.44 |
| Mini Cooper | 13,512 | 16,995 | -20.49 | 13,512 | 16,995 | -20.49 |
| Toyota Corolla Family | 142,720 | 137,209 | 4.02 | 142,720 | 137,209 | 4.02 |
| Opel Corsa | 80,072 | 91,411 | -12.40 | 80,072 | 91,411 | -12.40 |
| Chevrolet Corvette | 258 | 5 | 5,060.00 | 258 | 5 | 5,060.00 |
| Honda CR-V | 17,312 | 20,239 | -14.46 | 17,312 | 20,239 | -14.46 |
| Volkswagen Crafter Combi | 3,142 | 0 | 0.00 | 3,142 | 0 | 0.00 |
| Opel Crossland X | 51,450 | 71,680 | -28.22 | 51,450 | 71,680 | -28.22 |
| Subaru CrossTrek | 7,139 | 7,341 | -2.75 | 7,139 | 7,341 | -2.75 |
| Lexus CT | 1,237 | 4,501 | -72.52 | 1,237 | 4,501 | -72.52 |
| Rolls Royce Cullinan | 269 | 303 | -11.22 | 269 | 303 | -11.22 |
| Mazda CX-3 | 13,879 | 5,171 | 168.40 | 13,879 | 5,171 | 168.40 |
| Mazda CX-30 | 49,153 | 48,801 | 0.72 | 49,153 | 48,801 | 0.72 |
| Mazda CX-4 | 19,383 | 48,796 | -60.28 | 19,383 | 48,796 | -60.28 |
| Mazda CX-5 | 28,889 | 31,703 | -8.88 | 28,889 | 31,703 | -8.88 |
| Rolls Royce Dawn | 58 | 86 | -32.56 | 58 | 86 | -32.56 |
| Aston Martin DB11 | 334 | 545 | -38.72 | 334 | 545 | -38.72 |
| Aston Martin DBS Superleggera | 286 | 366 | -21.86 | 286 | 366 | -21.86 |
| Aston Martin DBX | 692 | 305 | 126.89 | 692 | 305 | 126.89 |
| Land Rover Defender | 14,936 | 8,729 | 71.11 | 14,936 | 8,729 | 71.11 |
| Land Rover Discovery Sport | 22,378 | 26,320 | -14.98 | 22,378 | 26,320 | -14.98 |
| Fiat Doblo | 435 | 1,137 | -61.74 | 435 | 1,137 | -61.74 |
| Dacia Dokker | 7,508 | 32,603 | -76.97 | 7,508 | 32,603 | -76.97 |
| DR Motor DR3 | 1,645 | 568 | 189.61 | 1,645 | 568 | 189.61 |
| DR Motor DR4 | 58 | 744 | -92.20 | 58 | 744 | -92.20 |
| DR Motor DR5 | 2,028 | 1,560 | 30.00 | 2,028 | 1,560 | 30.00 |
| DR Motor DR6 | 197 | 568 | -65.32 | 197 | 568 | -65.32 |
| DS DS3 Crossback | 15,908 | 19,496 | -18.40 | 15,908 | 19,496 | -18.40 |
| DS DS4 | 1,755 | 2 | 87,650.00 | 1,755 | 2 | 87,650.00 |
| DS DS7 Crossback | 24,529 | 24,087 | 1.84 | 24,529 | 24,087 | 1.84 |
| DS DS9 | 1,778 | 0 | 0.00 | 1,778 | 0 | 0.00 |
| Fiat Ducato | 46,119 | 49,020 | -5.92 | 46,119 | 49,020 | -5.92 |
| Dodge Durango | 424 | 0 | 0.00 | 424 | 0 | 0.00 |
| Dacia Duster | 144,772 | 139,269 | 3.95 | 144,772 | 139,269 | 3.95 |
| Mercedes-Benz E-Class | 53,654 | 70,171 | -23.54 | 53,654 | 70,171 | -23.54 |
| Citroen E-Mehari | 1 | 78 | -98.72 | 1 | 78 | -98.72 |
| Jaguar E-Pace | 11,225 | 14,847 | -24.40 | 11,225 | 14,847 | -24.40 |
| Audi e-Tron GT | 4,927 | 0 | 0.00 | 4,927 | 0 | 0.00 |
| Audi e-Tron Sportback | 11,087 | 1,355 | 718.23 | 11,087 | 1,355 | 718.23 |
| Mitsubishi Eclipse | 13,716 | 13,772 | -0.41 | 13,716 | 13,772 | -0.41 |
| Mitsubishi Eclipse Cross | 13,716 | 13,772 | -0.41 | 13,716 | 13,772 | -0.41 |
| Ford Edge | 348 | 3,698 | -90.59 | 348 | 3,698 | -90.59 |
| Lotus Elise | 321 | 303 | 5.94 | 321 | 303 | 5.94 |
| Skoda Enyaq | 48,283 | 186 | 25,858.60 | 48,283 | 186 | 25,858.60 |
| Mercedes-Benz EQA | 327 | 0 | 0.00 | 327 | 0 | 0.00 |
| Mercedes-Benz EQC | 18,233 | 14,645 | 24.50 | 18,233 | 14,645 | 24.50 |
| Mercedes-Benz EQS-Sedan | 1,027 | 0 | 0.00 | 1,027 | 0 | 0.00 |
| Lexus ES | 4,440 | 3,699 | 20.03 | 4,440 | 3,699 | 20.03 |
| NIO ES8 | 200 | 0 | 0.00 | 200 | 0 | 0.00 |
| Cadillac Escalade | 91 | 19 | 378.95 | 91 | 19 | 378.95 |
| Renault Espace | 3,110 | 4,390 | -29.16 | 3,110 | 4,390 | -29.16 |
| Audi eTron | 20,755 | 27,713 | -25.11 | 20,755 | 27,713 | -25.11 |
| Maxus Euniq 5 | 5,424 | 81 | 6,596.30 | 5,424 | 81 | 6,596.30 |
| Kia EV6 | 7,941 | 0 | 0.00 | 7,941 | 0 | 0.00 |
| Lotus Evora | 40 | 44 | -9.09 | 40 | 44 | -9.09 |
| Lotus Exige | 273 | 250 | 9.20 | 273 | 250 | 9.20 |
| Ford Explorer | 4,834 | 2,526 | 91.37 | 4,834 | 2,526 | 91.37 |
| Jaguar F-Pace | 12,055 | 11,026 | 9.33 | 12,055 | 11,026 | 9.33 |
| Jaguar F-Type | 2,363 | 2,713 | -12.90 | 2,363 | 2,713 | -12.90 |
| DR Motor F35 | 1,266 | 0 | 0.00 | 1,266 | 0 | 0.00 |
| Ferrari F8 Tributo | 2,265 | 747 | 203.21 | 2,265 | 747 | 203.21 |
| Skoda Fabia | 90,212 | 97,906 | -7.86 | 90,212 | 97,906 | -7.86 |
| Ford Fiesta | 86,385 | 156,067 | -44.65 | 86,385 | 156,067 | -44.65 |
| Bentley Flying Spur | 451 | 438 | 2.97 | 451 | 438 | 2.97 |
| Ford Focus | 101,066 | 173,853 | -41.87 | 101,066 | 173,853 | -41.87 |
| Subaru Forester | 6,179 | 6,377 | -3.10 | 6,179 | 6,377 | -3.10 |
| Smart ForFour | 8,823 | 7,640 | 15.48 | 8,823 | 7,640 | 15.48 |
| Smart ForTwo | 26,869 | 19,576 | 37.25 | 26,869 | 19,576 | 37.25 |
| Mercedes-Benz G-Class | 7,116 | 6,342 | 12.20 | 7,116 | 6,342 | 12.20 |
| SWM Motor G01 | 6,073 | 13,747 | -55.82 | 6,073 | 13,747 | -55.82 |
| Genesis G70 | 96 | 0 | 0.00 | 96 | 0 | 0.00 |
| Ford Galaxy | 4,914 | 8,018 | -38.71 | 4,914 | 8,018 | -38.71 |
| Maserati Ghibli | 1,434 | 1,006 | 42.54 | 1,434 | 1,006 | 42.54 |
| Rolls Royce Ghost | 186 | 89 | 108.99 | 186 | 89 | 108.99 |
| Alfa Romeo Giulia | 6,297 | 7,436 | -15.32 | 6,297 | 7,436 | -15.32 |
| Alfa Romeo Giulietta | 2,986 | 10,817 | -72.40 | 2,986 | 10,817 | -72.40 |
| Mercedes-Benz GL/GLS-Class | 4,110 | 4,795 | -14.29 | 4,110 | 4,795 | -14.29 |
| Mercedes-Benz GLA-Class | 75,124 | 55,911 | 34.36 | 75,124 | 55,911 | 34.36 |
| Mercedes-Benz GLB | 34,628 | 27,223 | 27.20 | 34,628 | 27,223 | 27.20 |
| Mercedes-Benz GLC/GLK-Class | 74,949 | 99,160 | -24.42 | 74,949 | 99,160 | -24.42 |
| Jeep Grand Cherokee | 534 | 4,636 | -88.48 | 534 | 4,636 | -88.48 |
| Nissan GT-R | 193 | 0 | 0.00 | 193 | 0 | 0.00 |
| Toyota GT86 | 27 | 671 | -95.98 | 27 | 671 | -95.98 |
| Ferrari GTC4Lusso | 42 | 142 | -70.42 | 42 | 142 | -70.42 |
| Genesis GV70 | 143 | 0 | 0.00 | 143 | 0 | 0.00 |
| Genesis GV80 | 166 | 0 | 0.00 | 166 | 0 | 0.00 |
| Hyundai H1 | 36 | 596 | -93.96 | 36 | 596 | -93.96 |
| MG HS | 16,460 | 2,893 | 468.96 | 16,460 | 2,893 | 468.96 |
| Lamborghini Huracan | 585 | 507 | 15.38 | 585 | 507 | 15.38 |
| Jaguar I-Pace | 8,079 | 13,444 | -39.91 | 8,079 | 13,444 | -39.91 |
| Hyundai i10 | 56,074 | 50,233 | 11.63 | 56,074 | 50,233 | 11.63 |
| Hyundai i20 | 61,662 | 63,301 | -2.59 | 61,662 | 63,301 | -2.59 |
| BMW i3 | 25,029 | 23,361 | 7.14 | 25,029 | 23,361 | 7.14 |
| BMW i8 | 46 | 592 | -92.23 | 46 | 592 | -92.23 |
| Seat Ibiza | 68,750 | 62,832 | 9.42 | 68,750 | 62,832 | 9.42 |
| Volkswagen ID.3 | 72,723 | 54,495 | 33.45 | 72,723 | 54,495 | 33.45 |
| Volkswagen ID.4 | 53,605 | 4,810 | 1,014.45 | 53,605 | 4,810 | 1,014.45 |
| JAC iEV7s | 127 | 0 | 0.00 | 127 | 0 | 0.00 |
| Suzuki Ignis | 42,206 | 37,568 | 12.35 | 42,206 | 37,568 | 12.35 |
| Subaru Impreza | 529 | 514 | 2.92 | 529 | 514 | 2.92 |
| Opel Insignia | 20,384 | 21,133 | -3.54 | 20,384 | 21,133 | -3.54 |
| Peugeot iOn | 4 | 333 | -98.80 | 4 | 333 | -98.80 |
| Hyundai Ioniq | 23,400 | 26,254 | -10.87 | 23,400 | 26,254 | -10.87 |
| Lexus IS | 551 | 1,855 | -70.30 | 551 | 1,855 | -70.30 |
| Hyundai ix20 | 3 | 726 | -99.59 | 3 | 726 | -99.59 |
| Honda Jazz | 30,503 | 25,182 | 21.13 | 30,503 | 25,182 | 21.13 |
| Suzuki Jimny | 563 | 10,063 | -94.41 | 563 | 10,063 | -94.41 |
| Dacia Jogger | 26 | 0 | 0.00 | 26 | 0 | 0.00 |
| Nissan Juke | 62,535 | 58,402 | 7.08 | 62,535 | 58,402 | 7.08 |
| Citroen Jumper | 13,939 | 0 | 0.00 | 13,939 | 0 | 0.00 |
| Renault Kadjar | 33,318 | 63,685 | -47.68 | 33,318 | 63,685 | -47.68 |
| Skoda Kamiq | 82,461 | 75,559 | 9.13 | 82,461 | 75,559 | 9.13 |
| Renault Kangoo | 7,856 | 8,838 | -11.11 | 7,856 | 8,838 | -11.11 |
| Skoda Karoq | 73,958 | 82,121 | -9.94 | 73,958 | 82,121 | -9.94 |
| Skoda Kodiaq | 57,452 | 69,516 | -17.35 | 57,452 | 69,516 | -17.35 |
| Renault Koleos | 6,048 | 6,916 | -12.55 | 6,048 | 6,916 | -12.55 |
| Hyundai Kona | 109,934 | 126,980 | -13.42 | 109,934 | 126,980 | -13.42 |
| Ford Kuga | 111,472 | 91,082 | 22.39 | 111,472 | 91,082 | 22.39 |
| Toyota Land Cruiser | 4,458 | 4,489 | -0.69 | 4,458 | 4,489 | -0.69 |
| Lexus LC | 369 | 260 | 41.92 | 369 | 260 | 41.92 |
| Nissan Leaf | 33,772 | 31,177 | 8.32 | 33,772 | 31,177 | 8.32 |
| Subaru Legacy | 6,045 | 3,844 | 57.26 | 6,045 | 3,844 | 57.26 |
| Seat Leon | 96,459 | 111,045 | -13.14 | 96,459 | 111,045 | -13.14 |
| Subaru Levorg | 417 | 825 | -49.45 | 417 | 825 | -49.45 |
| Dacia Lodgy | 15,803 | 19,639 | -19.53 | 15,803 | 19,639 | -19.53 |
| Dacia Logan | 16,134 | 38,408 | -57.99 | 16,134 | 38,408 | -57.99 |
| Lexus LS | 117 | 98 | 19.39 | 117 | 98 | 19.39 |
| Porsche Macan | 15,757 | 16,865 | -6.57 | 15,757 | 16,865 | -6.57 |
| BMW Marvel R | 792 | 0 | 0.00 | 792 | 0 | 0.00 |
| Renault Master Passenger | 2,125 | 0 | 0.00 | 2,125 | 0 | 0.00 |
| Nissan Maxima | 33,772 | 31,177 | 8.32 | 33,772 | 31,177 | 8.32 |
| Maserati MC12 | 115 | 0 | 0.00 | 115 | 0 | 0.00 |
| Maserati MC20 | 115 | 0 | 0.00 | 115 | 0 | 0.00 |
| Renault Megane | 68,692 | 74,536 | -7.84 | 68,692 | 74,536 | -7.84 |
| Renault Megane e-Tech | 45 | 0 | 0.00 | 45 | 0 | 0.00 |
| Nissan Micra | 36,340 | 39,721 | -8.51 | 36,340 | 39,721 | -8.51 |
| Seat Mii | 9,428 | 7,790 | 21.03 | 9,428 | 7,790 | 21.03 |
| Toyota Mirai | 692 | 422 | 63.98 | 692 | 422 | 63.98 |
| Tesla Model 3 | 140,868 | 85,979 | 63.84 | 140,868 | 85,979 | 63.84 |
| Tesla Model S | 456 | 5,562 | -91.80 | 456 | 5,562 | -91.80 |
| Tesla Model X | 496 | 6,007 | -91.74 | 496 | 6,007 | -91.74 |
| Tesla Model Y | 28,687 | 0 | 0.00 | 28,687 | 0 | 0.00 |
| Opel Mokka | 70,313 | 136 | 51,600.74 | 70,313 | 136 | 51,600.74 |
| Ford Mondeo | 13,481 | 21,222 | -36.48 | 13,481 | 21,222 | -36.48 |
| Ferrari Monza | 470 | 1,135 | -58.59 | 470 | 1,135 | -58.59 |
| Opel Movano Tour | 112 | 0 | 0.00 | 112 | 0 | 0.00 |
| Bentley Mulsanne | 19 | 69 | -72.46 | 19 | 69 | -72.46 |
| Ford Mustang | 3,865 | 7,495 | -48.43 | 3,865 | 7,495 | -48.43 |
| Ford Mustang Mach E | 23,054 | 185 | 12,361.62 | 23,054 | 185 | 12,361.62 |
| Mazda MX-30 | 12,249 | 9,477 | 29.25 | 12,249 | 9,477 | 29.25 |
| Mazda MX-5 Miata | 6,861 | 4,815 | 42.49 | 6,861 | 4,815 | 42.49 |
| Hyundai Nexo | 214 | 468 | -54.27 | 214 | 468 | -54.27 |
| Kia Niro | 88,843 | 77,830 | 14.15 | 88,843 | 77,830 | 14.15 |
| Lada Niva | 1,384 | 1,362 | 1.62 | 1,384 | 1,362 | 1.62 |
| Honda NSX | 3 | 8 | -62.50 | 3 | 8 | -62.50 |
| Nissan NV200 | 1,226 | 1,792 | -31.58 | 1,226 | 1,792 | -31.58 |
| Nissan NV250 | 80 | 0 | 0.00 | 80 | 0 | 0.00 |
| Nissan NV300 | 993 | 1,189 | -16.48 | 993 | 1,189 | -16.48 |
| Lexus NX | 13,773 | 13,284 | 3.68 | 13,773 | 13,284 | 3.68 |
| Skoda Octavia | 151,442 | 180,902 | -16.29 | 151,442 | 180,902 | -16.29 |
| Kia Optima | 430 | 6,086 | -92.93 | 430 | 6,086 | -92.93 |
| Mitsubishi Outlander | 13,897 | 33,729 | -58.80 | 13,897 | 33,729 | -58.80 |
| XPeng P5 | 7,865 | 0 | 0.00 | 7,865 | 0 | 0.00 |
| XPeng P7 | 40 | 0 | 0.00 | 40 | 0 | 0.00 |
| Mini Paceman | 45,375 | 45,139 | 0.52 | 45,375 | 45,139 | 0.52 |
| Chrysler Pacifica | 94 | 0 | 0.00 | 94 | 0 | 0.00 |
| Porsche Panamera | 5,097 | 4,308 | 18.31 | 5,097 | 4,308 | 18.31 |
| Fiat Panda | 131,723 | 145,907 | -9.72 | 131,723 | 145,907 | -9.72 |
| Volkswagen Passat | 82,488 | 115,363 | -28.50 | 82,488 | 115,363 | -28.50 |
| Rolls Royce Phantom | 41 | 46 | -10.87 | 41 | 46 | -10.87 |
| Kia Picanto | 59,949 | 49,211 | 21.82 | 59,949 | 49,211 | 21.82 |
| Polestar Polestar 1 | 61 | 65 | -6.15 | 61 | 65 | -6.15 |
| Polestar Polestar 2 | 8,746 | 20,949 | -58.25 | 8,746 | 20,949 | -58.25 |
| Volkswagen Polo | 154,066 | 169,467 | -9.09 | 154,066 | 169,467 | -9.09 |
| Ferrari Portofino | 1,057 | 44 | 2,302.27 | 1,057 | 44 | 2,302.27 |
| Toyota Prius | 5,982 | 9,210 | -35.05 | 5,982 | 9,210 | -35.05 |
| Toyota Proace City Verso | 11,856 | 8,491 | 39.63 | 11,856 | 8,491 | 39.63 |
| Toyota Proace Verso | 9,388 | 9,270 | 1.27 | 9,388 | 9,270 | 1.27 |
| Ford Puma | 134,431 | 11,818 | 1,037.51 | 134,431 | 11,818 | 1,037.51 |
| Audi Q2 | 54,614 | 57,825 | -5.55 | 54,614 | 57,825 | -5.55 |
| Audi Q3 | 92,445 | 89,789 | 2.96 | 92,445 | 89,789 | 2.96 |
| Audi Q4 e-tron | 16,472 | 0 | 0.00 | 16,472 | 0 | 0.00 |
| Audi Q4 e-tron Sportback | 3,111 | 0 | 0.00 | 3,111 | 0 | 0.00 |
| Audi Q5 | 61,094 | 53,523 | 14.15 | 61,094 | 53,523 | 14.15 |
| Audi Q7 | 13,576 | 17,413 | -22.04 | 13,576 | 17,413 | -22.04 |
| Audi Q8 | 12,378 | 12,983 | -4.66 | 12,378 | 12,983 | -4.66 |
| Nissan Qashqai | 113,276 | 135,829 | -16.60 | 113,276 | 135,829 | -16.60 |
| Maserati Quattroporte | 115 | 116 | -0.86 | 115 | 116 | -0.86 |
| Fiat Qubo | 15 | 263 | -94.30 | 15 | 263 | -94.30 |
| Audi R8 | 666 | 747 | -10.84 | 666 | 747 | -10.84 |
| Land Rover Range Rover Evoque | 31,217 | 37,231 | -16.15 | 31,217 | 37,231 | -16.15 |
| Land Rover Range Rover Sport | 17,385 | 17,500 | -0.66 | 17,385 | 17,500 | -0.66 |
| Land Rover Range Rover Velar | 11,212 | 12,784 | -12.30 | 11,212 | 12,784 | -12.30 |
| Ford Ranger | 54,466 | 43,046 | 26.53 | 54,466 | 43,046 | 26.53 |
| Toyota RAV4 | 102,208 | 90,761 | 12.61 | 102,208 | 90,761 | 12.61 |
| Lexus RC | 96 | 710 | -86.48 | 96 | 710 | -86.48 |
| Jeep Renegade | 62,981 | 58,975 | 6.79 | 62,981 | 58,975 | 6.79 |
| Soueast Rexton | 957 | 374 | 155.88 | 957 | 374 | 155.88 |
| Peugeot Rifter | 25,211 | 41,714 | -39.56 | 25,211 | 41,714 | -39.56 |
| Kia Rio | 34,265 | 33,052 | 3.67 | 34,265 | 33,052 | 3.67 |
| Ferrari Roma | 643 | 34 | 1,791.18 | 643 | 34 | 1,791.18 |
| Lexus RX | 5,347 | 5,556 | -3.76 | 5,347 | 5,556 | -3.76 |
| Mercedes-Benz S-Class | 11,069 | 6,239 | 77.42 | 11,069 | 6,239 | 77.42 |
| Suzuki S-Cross | 25,261 | 20,776 | 21.59 | 25,261 | 20,776 | 21.59 |
| Ford S-Max | 7,740 | 13,375 | -42.13 | 7,740 | 13,375 | -42.13 |
| Dacia Sandero | 193,486 | 167,032 | 15.84 | 193,486 | 167,032 | 15.84 |
| Hyundai Santa Fe | 9,991 | 7,189 | 38.98 | 9,991 | 7,189 | 38.98 |
| Skoda Scala | 43,924 | 53,156 | -17.37 | 43,924 | 53,156 | -17.37 |
| Renault Scenic | 20,678 | 36,592 | -43.49 | 20,678 | 36,592 | -43.49 |
| Volkswagen Sharan | 7,637 | 11,473 | -33.44 | 7,637 | 11,473 | -33.44 |
| Mercedes-Benz SL-Class | 84 | 505 | -83.37 | 84 | 505 | -83.37 |
| Mercedes-Benz SLC-Class | 0 | 2,054 | -100.00 | 0 | 2,054 | -100.00 |
| Kia Sorento | 16,436 | 6,885 | 138.72 | 16,436 | 6,885 | 138.72 |
| Kia Soul | 8,144 | 8,038 | 1.32 | 8,144 | 8,038 | 1.32 |
| Mitsubishi Space Star | 32,662 | 35,703 | -8.52 | 32,662 | 35,703 | -8.52 |
| Citroen Spacetourer | 8,100 | 6,548 | 23.70 | 8,100 | 6,548 | 23.70 |
| Kia Sportage | 85,509 | 69,016 | 23.90 | 85,509 | 69,016 | 23.90 |
| Dacia Spring | 25,740 | 1,724 | 1,393.04 | 25,740 | 1,724 | 1,393.04 |
| Hyundai Staria | 386 | 0 | 0.00 | 386 | 0 | 0.00 |
| Alfa Romeo Stelvio | 16,650 | 17,438 | -4.52 | 16,650 | 17,438 | -4.52 |
| Fiat Stilo | 38,673 | 53,452 | -27.65 | 38,673 | 53,452 | -27.65 |
| Kia Stinger | 1,142 | 1,387 | -17.66 | 1,142 | 1,387 | -17.66 |
| Kia Stonic | 55,510 | 51,498 | 7.79 | 55,510 | 51,498 | 7.79 |
| Toyota Supra | 966 | 947 | 2.01 | 966 | 947 | 2.01 |
| Suzuki Swace | 2,263 | 6,327 | -64.23 | 2,263 | 6,327 | -64.23 |
| Suzuki Swift | 59,217 | 51,134 | 15.81 | 59,217 | 51,134 | 15.81 |
| Volkswagen T-Cross | 125,325 | 113,320 | 10.59 | 125,325 | 113,320 | 10.59 |
| Volkswagen T-Roc | 181,577 | 158,638 | 14.46 | 181,577 | 158,638 | 14.46 |
| Volkswagen Taigo | 1,688 | 0 | 0.00 | 1,688 | 0 | 0.00 |
| Fiat Talento | 38,673 | 51,337 | -24.67 | 38,673 | 51,337 | -24.67 |
| Renault Talisman | 5,608 | 8,025 | -30.12 | 5,608 | 8,025 | -30.12 |
| BYD Tang | 1,068 | 0 | 0.00 | 1,068 | 0 | 0.00 |
| Seat Tarraco | 21,694 | 21,229 | 2.19 | 21,694 | 21,229 | 2.19 |
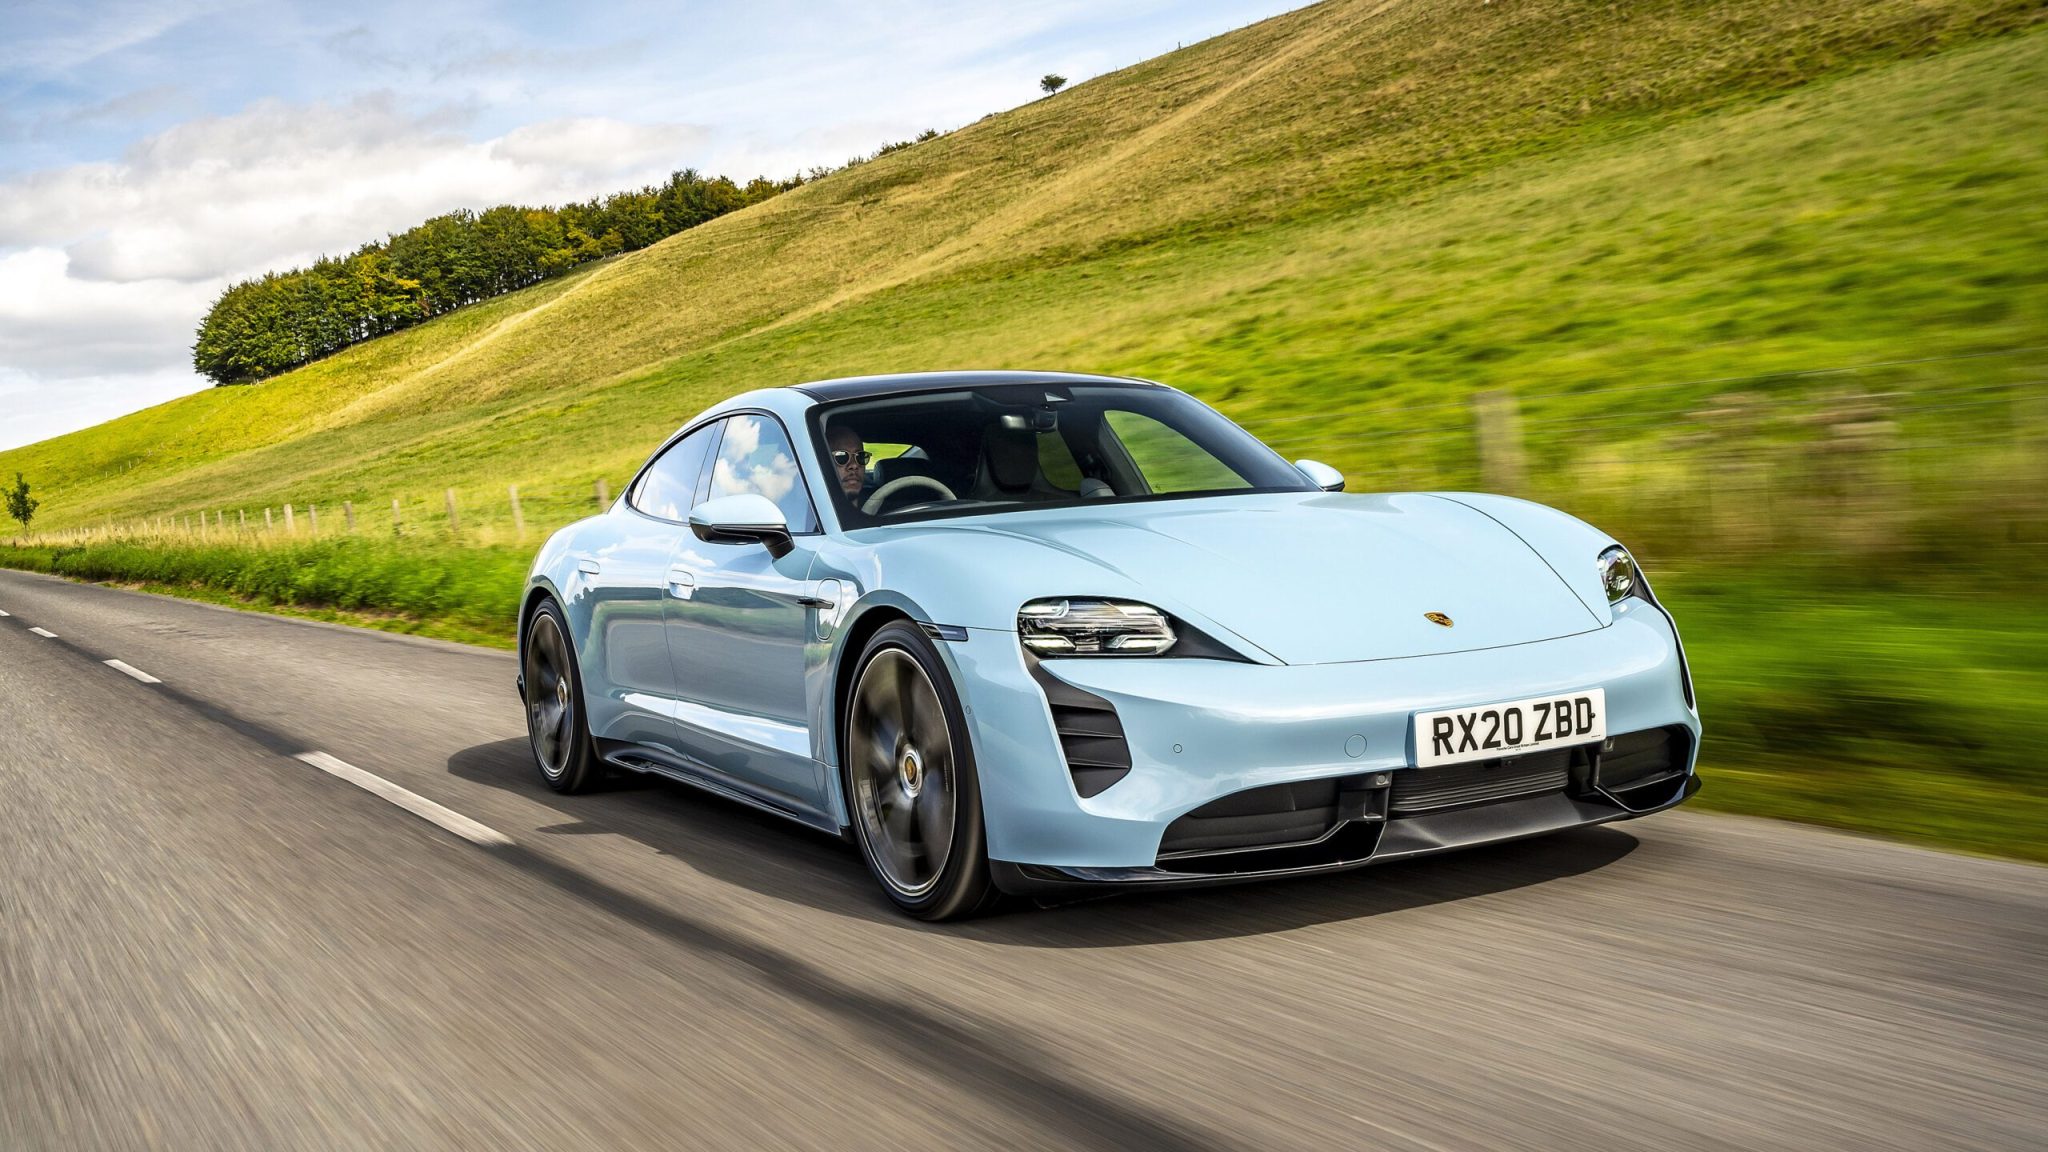
| Porsche Taycan | 16,250 | 12,332 | 31.77 | 16,250 | 12,332 | 31.77 |
| Volkswagen Tiguan | 132,601 | 176,288 | -24.78 | 132,601 | 176,288 | -24.78 |
| Fiat Tipo | 38,673 | 53,452 | -27.65 | 38,673 | 53,452 | -27.65 |
| Soueast Tivoli | 3,804 | 3,831 | -0.70 | 3,804 | 3,831 | -0.70 |
| Volkswagen Touareg | 13,087 | 14,275 | -8.32 | 13,087 | 14,275 | -8.32 |
| Volkswagen Touran | 30,543 | 47,222 | -35.32 | 30,543 | 47,222 | -35.32 |
| Ford Tourneo Connect | 2,761 | 7,148 | -61.37 | 2,761 | 7,148 | -61.37 |
| Ford Tourneo Courier | 2,761 | 7,148 | -61.37 | 2,761 | 7,148 | -61.37 |
| Ford Tourneo Custom | 26,033 | 20,555 | 26.65 | 26,033 | 20,555 | 26.65 |
| Renault Trafic Passenger | 8,338 | 11,870 | -29.76 | 8,338 | 11,870 | -29.76 |
| Ford Transit | 7,003 | 8,364 | -16.27 | 7,003 | 8,364 | -16.27 |
| Volkswagen Transporter | 46,377 | 47,817 | -3.01 | 46,377 | 47,817 | -3.01 |
| Peugeot Traveller | 7,503 | 8,312 | -9.73 | 7,503 | 8,312 | -9.73 |
| Audi TT | 5,812 | 7,525 | -22.76 | 5,812 | 7,525 | -22.76 |
| Hyundai Tuscon | 143,836 | 90,594 | 58.77 | 143,836 | 90,594 | 58.77 |
| Renault Twingo | 58,161 | 73,345 | -20.70 | 58,161 | 73,345 | -20.70 |
| Aiways U5 | 996 | 550 | 81.09 | 996 | 550 | 81.09 |
| Volkswagen Up! | 69,400 | 59,578 | 16.49 | 69,400 | 59,578 | 16.49 |
| Lamborghini Urus | 1,280 | 1,087 | 17.76 | 1,280 | 1,087 | 17.76 |
| Lexus UX | 20,320 | 17,077 | 18.99 | 20,320 | 17,077 | 18.99 |
| Mercedes-Benz V-Class | 20,071 | 24,165 | -16.94 | 20,071 | 24,165 | -16.94 |
| Aston Martin Vantage | 632 | 352 | 79.55 | 632 | 352 | 79.55 |
| Lada Vesta | 2 | 562 | -99.64 | 2 | 562 | -99.64 |
| Mercedes-Benz Vito/Viano | 16,343 | 13,917 | 17.43 | 16,343 | 13,917 | 17.43 |
| Opel Vivaro Tour | 2,396 | 1,489 | 60.91 | 2,396 | 1,489 | 60.91 |
| Rolls Royce Wraith | 59 | 71 | -16.90 | 59 | 71 | -16.90 |
| Jeep Wrangler | 8,723 | 7,262 | 20.12 | 8,723 | 7,262 | 20.12 |
| Nissan X-Trail | 10,512 | 19,376 | -45.75 | 10,512 | 19,376 | -45.75 |
| BMW X1 | 86,749 | 88,486 | -1.96 | 86,749 | 88,486 | -1.96 |
| BMW X2 | 28,699 | 32,745 | -12.36 | 28,699 | 32,745 | -12.36 |
| BMW X3 | 81,466 | 61,740 | 31.95 | 81,466 | 61,740 | 31.95 |
| BMW X4 | 15,151 | 16,981 | -10.78 | 15,151 | 16,981 | -10.78 |
| BMW X5 | 43,103 | 40,961 | 5.23 | 43,103 | 40,961 | 5.23 |
| BMW X6 | 10,183 | 10,460 | -2.65 | 10,183 | 10,460 | -2.65 |
| Volvo XC40 | 123,847 | 110,254 | 12.33 | 123,847 | 110,254 | 12.33 |
| Volvo XC60 | 73,165 | 70,533 | 3.73 | 73,165 | 70,533 | 3.73 |
| Volvo XC90 | 29,339 | 24,584 | 19.34 | 29,339 | 24,584 | 19.34 |
| Kia XCeed | 44,522 | 45,023 | -1.11 | 44,522 | 45,023 | -1.11 |
| Jaguar XE | 2,039 | 3,780 | -46.06 | 2,039 | 3,780 | -46.06 |
| Jaguar XF | 1,776 | 2,450 | -27.51 | 1,776 | 2,450 | -27.51 |
| Jaguar XJ | 11 | 247 | -95.55 | 11 | 247 | -95.55 |
| Soueast XLV | 145 | 251 | -42.23 | 145 | 251 | -42.23 |
| Cadillac XT4 | 405 | 87 | 365.52 | 405 | 87 | 365.52 |
| Subaru XV Crosstrek | 7,139 | 7,341 | -2.75 | 7,139 | 7,341 | -2.75 |
| Toyota Yaris | 178,032 | 179,867 | -1.02 | 178,032 | 179,867 | -1.02 |
| Lancia Ypsilon | 43,862 | 86,152 | -49.09 | 87,724 | 86,152 | 1.82 |
| Lancia Ypsilon | 43,862 | 86,152 | -49.09 | 87,724 | 86,152 | 1.82 |
| BMW Z4 | 7,571 | 8,314 | -8.94 | 7,571 | 8,314 | -8.94 |
| Opel Zafira Life | 8,659 | 9,696 | -10.70 | 8,659 | 9,696 | -10.70 |
| Renault Zoe | 69,136 | 99,432 | -30.47 | 69,136 | 99,432 | -30.47 |
| MG ZS | 18,690 | 19,676 | -5.01 | 18,690 | 19,676 | -5.01 |
| ∑ = 11,075,162 | ∑ = 11,324,027 | ∑ = 11,187,458 | ∑ = 11,324,027 |


