The European car market seemed to be on another year of growth after the first half of 2018, when sales were up 3%. After July, the year-to-date figure was up 3,5%, but then the introduction of the new WLTP fuel efficiency standards caused total chaos in the sales charts. August sales were up 26,3% as carmakers rushed to register unsold non-compliant model/engine combinations before the September 1 deadline. From that date onwards, only vehicle types that had been tested under the new standard for fuel consuption and emissions testing were allowed to be sold as new vehicles in Europe. As a lot of model/engine combinations had not been tested yet and would no longer be available in Europe until they were tested. Some brands and manufacturers were better prepared than others, but overall the market sunk by more than 7% in each of the last four months of the year and this adverse effect will continue to negatively influence the European car market in the first few months of 2019. December was actually the worst month of the year, both in terms of absolute figures (just over 1 million sales) and in comparison to the year before (except for the dramatic September month of course), with a decline of 8,6%.
A total of 15,46 million passenger cars were sold in 2018 in the countries of the European Union and the three member of the European Free Trade Agreement (Iceland, Norway and Switzerland), a decrease of 0,23% on 2017. That makes 2018 the second-best year of the last 11 and the sixth best ever year, so things aren’t all bad for the overall market. As you will see below, some brands took a significant beating though. Sales of car models (sedan, hatchback, station wagon, coupe and convertible) were down 5,1% and held 57,3% of the market. SUV sales were up 16,3% to 34,9% of the market (compared to 30% in 2017), while MPV sales shrunk by 22% to just 7,8% of the market (down from 10% in 2017).
Big differences also exist between countries, with Central European countries doing the heavy lifting with a total gain of 8%. Most notable were Lithuania up 25,4% and Romania up 23,1%, followed by Croatia (+18,7%), Hungary (+17,5%) and Greece (+17,4%) all up by double digits. On the other hand, Iceland was down 15,6% as the only country to lose by double digits, with 6,8% losses for the UK, Sweden and Norway. Among the major markets, Spain (+7%) and France (+3%) posted growth, while the German (-0,2%) and Italian (-3,1%) markets contracted.
Manufacturers and brands
South-Korean manufacturer Hyundai-Kia is the biggest winner of 2018 with almost 50.000 additional sales as its two brands played catch up in the popular small crossover segment. Toyota Motor grows by just under half that volume, followed by Geely thanks to its Volvo brand that adds just over 17.500 sales last year. Biggest losers are Renault-Nissan, the big winner of the year before which lost almost half of the volume it gained in 2017, at -41.500 sales, mostly due to the WLTP standards. Renault-Nissan was up by more than 62.000 sales at the end of August. Daimler AG and FCA Fiat Chrysler Automobiles both lost around 30.000 sales in 2018, the latter of which was also still in positive territory before September started. Relatively speaking, SAIC Motor is the only manufacturer to more than double its sales volume in 2018 despite still only being sold in the UK, one of the fastest declining markets in Europe. Tata Motors with its Jaguar and Land Rover brands, as well as Geely with its Volvo brand are the next fastest growing manufacturers, both at +5,8%. In contrast, Mahindra & Mahindra was the only manufacturer to suffer double digit losses due to its SsangYong brand, while Aston Martin (-7,6%) and Daimler AG (-3,1%) were also among the fastest declining manufacturers, just ahead of Honda (-3%).
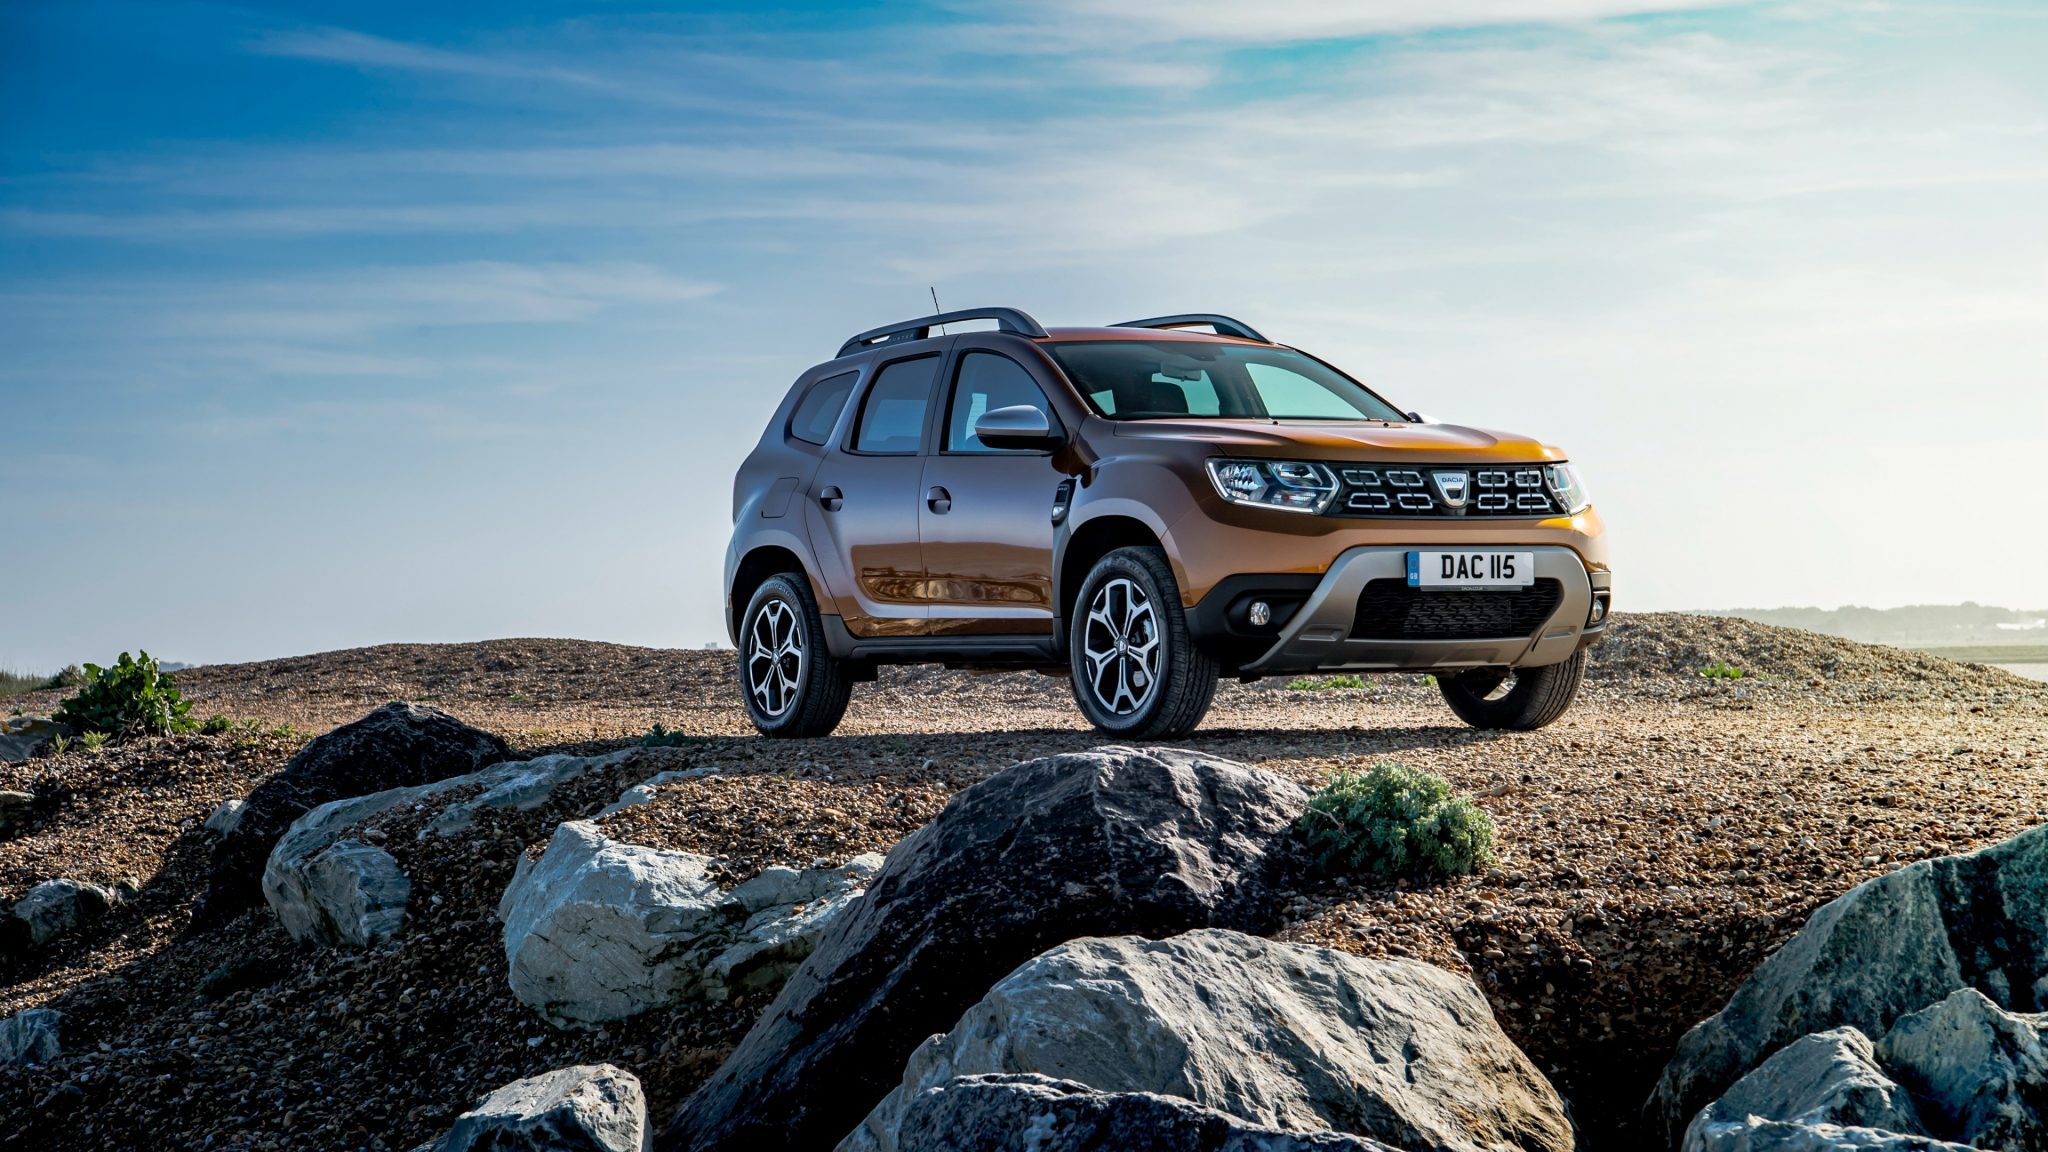
Among brands, Dacia is the biggest winner in Europe at almost +62.000 sales, closely followed by Jeep at almost +57.500 sales, ironically both brands from two of the three biggest losing manufacturers. After November, Peugeot was the #3 biggest growing brand in Europe, but it was overtaken in December by Seat (+46.500 vs. 44.700 sales). Audi is by far the biggest hit by the WLTP standards, losing almost 110.000 sales in 2018, all lost in the last four months of the year as sales of the brand were in the black before September 1st. Nissan and Fiat also lost more than 70.000 sales in 2018, and both also lost most of their volume after September, as Nissan was down just 10.000 sales before the deadline kicked in, and Fiat was down 30.000 sales by then. Relatively, sales of the Chinese made and Italian assembled cars from DR Motor almost tripled, while India’s Mahindra and China’s SAIC MG were the only other brands to more than double their sales volumes. On the other end of the scale, Infiniti sales halved in 2018 as the brand hit a bump in its long and difficult road to acceptance in Europe. Sales of Lotus sports cars were down by a quarter as the brand is preparing a comeback under its new Chinese ownership by Geely. Bentley also saw an almost 20% decline in sales as it had to halt deliveries of some versions of its popular Bentayga SUV due to non-compliance with WLTP standards.
Winners and losers
Manufacturer biggest volume increase | Hyundai-Kia | 48.789 | Manufacturer biggest volume lost | Renault-Nissan | -41.506 | |
Toyota Motor | 24.276 | Daimler AG | -31.109 | |||
Geely | 17.520 | Fiat-Chrysler Automobiles | -29.878 | |||
Manufacturer biggest % increase | SAIC | 103,7% | Manufacturer biggest % lost | Mahindra & Mahindra | -10,4% | |
Tesla Motors | 5,8% | Aston Martin | -7,6% | |||
Geely | 5,8% | Daimler AG | -3,1% | |||
Brand biggest volume increase | Dacia | 61.902 | Brand biggest volume lost | Audi | -109.821 | |
Jeep | 57.489 | Nissan | -73.398 | |||
Seat | 46.530 | Fiat | -71.693 | |||
Brand biggest % increase | DR Motor | 195,2% | Brand biggest % lost | Infiniti | -50,3% | |
Mahindra | 145,1% | Lotus | -25,4% | |||
SAIC MG | 103,7% | Bentley | -19,9% |
Volkswagen Group sees its sales shrink by just 0,6% and keeps its market share virtually stable at close to 24%. PSA manages to consolidate its second place among manufacturers with a 0,4% increase (when including Opel/Vauxhall for the full year) versus a 1,8% loss at Renault-Nissan, which loses 0,3 percentage points of market share. BMW AG holds on to its 4th place but is challenged by Hyundai-Kia which adds 0,3 percentage points of share and leapfrogs three other manufacturers to move from 8th place in 2017 to 5th place in 2018. Ford holds on to its #6 place by doing slightly less bad than FCA at -1,9% and -2,9% respectively. Daimler AG loses even more at -3,1% and is down to 8th place and back down below 1 million sales after just one year. For Hyundai-Kia, this is the 5th consecutive year of increased sales. At the back end of the top-10 we find Toyota and Geely both adding 0,1 percentage point of market share, while the remaining manufacturers all hold their positions of 2017.
2018 manufacturer ranking
Group | 2018 | 2017 | change | 2018 share | 2017 share | 2017 rank | |
1 | Volkswagen Group | 3.655.499 | 3.677.492 | -0,6% | 23,7% | 23,8% | 1 |
2 | PSA | 2.477.085 | 2.466.129 | 0,4% | 16,0% | 15,9% | 2 |
3 | Renault-Nissan | 2.243.985 | 2.285.491 | -1,8% | 14,5% | 14,8% | 3 |
4 | BMW AG | 1.035.018 | 1.039.878 | -0,5% | 6,7% | 6,7% | 4 |
5 | Hyundai-Kia | 1.021.381 | 972.592 | 5,0% | 6,6% | 6,3% | 8 |
6 | Ford Motor Comp. | 1.014.040 | 1.033.493 | -1,9% | 6,6% | 6,7% | 6 |
7 | Fiat-Chrysler Automobiles | 1.008.897 | 1.038.775 | -2,9% | 6,5% | 6,7% | 5 |
8 | Daimler AG | 975.334 | 1.006.443 | -3,1% | 6,3% | 6,5% | 7 |
9 | Toyota Motor | 744.862 | 720.586 | 3,4% | 4,8% | 4,7% | 9 |
10 | Geely Group | 319.783 | 302.263 | 5,8% | 2,1% | 2,0% | 10 |
11 | Suzuki | 245.653 | 240.875 | 2,0% | 1,6% | 1,6% | 11 |
12 | Tata Motors | 234.594 | 236.533 | -0,8% | 1,5% | 1,5% | 12 |
13 | Mazda | 231.070 | 227.784 | 1,4% | 1,5% | 1,5% | 13 |
14 | Honda | 136.191 | 140.430 | -3,0% | 0,9% | 0,9% | 14 |
15 | Subaru Corp. | 36.688 | 35.297 | 3,9% | 0,2% | 0,2% | 15 |
16 | Tesla Motors | 29.614 | 27.986 | 5,8% | 0,2% | 0,2% | 16 |
17 | Mahindra & Mahindra | 15.821 | 17.651 | -10,4% | 0,1% | 0,1% | 17 |
18 | SAIC | 9.050 | 4.442 | 103,7% | 0,1% | 0,0% | 18 |
19 | General Motors | 3.463 | 3.350 | 3,4% | 0,0% | 0,0% | 19 |
20 | Aston Martin | 2.296 | 2.484 | -7,6% | 0,0% | 0,0% | 20 |
In the brands ranking, Volkswagen still reigns supreme and adds market share while its closest rivals both lose share. Renault is hurt the most by the WLTP standards but maintains its position above Ford, while Peugeot moves ahead of Opel/Vauxhall into 4th place, closing in on Ford as well. Mercedes-Benz holds on to its title of best selling luxury brand, but Audi falls far behind. VW’s premium brand was on par with BMW a year ago, but is now more than 100.000 sales behind as it lost 13,3% of its volume and 0,7 percentage points of market share. Fiat is kicked out of the top-10 with sales down 9,3% and a loss of half a percentage point of share, as both Skoda and Toyota move alongside. Toyota almost wins 2 places as it closes to within 1.000 sales of Skoda as well. Hyundai feels Dacia breathing down its neck as the latter is the big winner in the top-20, moving past stablemate Nissan which is down three spots as the two South-Korean brands pass it as well. For the Japanese brand 2018 is the first year in the last four to sell fewer than half a million cars in Europe. Jeep wins three places and now outsells Land Rover in Europe, but also Mitsubishi and Honda, with the latter also falling behind its much smaller (on a worldwide scale) Japanese rival.
Smart drops below 100.000 sales after just two years, while Jaguar passes Alfa Romeo and Porsche while setting a new annual sales record in Europe for the third year in a row, at over 84.000 sales. Lexus passes DS and SAIC MG sets a fifth consecutive annual sales record in Europe, growing from just 500 sales in 2013 to over 9.000 sales in 2018 as the Chinese are slowly but steadily gaining a foothold in the UK before expanding to mainland Europe. New brand Alpine lands at #44 just above Lamborghini, while Dodge sells more than 1.000 cars in Europe for the first time since 2011 despite not even having official representation in the region. And this is excluding the RAM Pickup, which is mostly registered as a commercial vehicle but sells a multiple of Dodge’s figure in Europe, still all through grey market imports. After sales dropped to less than 350 cars in 2014 and remaining around that low level for three more years, DR Motor has slightly recovered in 2018, thanks to the launch of new models and expansion of its dealer network in Italy. Mahindra also brought a small crossover to its limited number of showrooms in Europe and has proven relatively successful, hitting 1.000 annual sales for the first time ever, almost doubling its previous record. Borgward launches in Europe with 32 sales from July through October, of which 23 in August, we don’t have confirmed data for November and December, but considering the single sale in October we estimate a total of 35 cars for 2018.
2018 brands ranking
Brand | 2018 | 2017 | change | 2018 share | 2017 share | 2017 rank | |
1 | Volkswagen | 1.717.108 | 1.685.004 | 1,9% | 11,1% | 10,9% | 1 |
2 | Renault | 1.083.664 | 1.133.277 | -4,4% | 7,0% | 7,3% | 2 |
3 | Ford | 1.014.037 | 1.033.491 | -1,9% | 6,6% | 6,7% | 3 |
4 | Peugeot | 962.201 | 917.486 | 4,9% | 6,2% | 5,9% | 5 |
5 | Opel/Vauxhall | 878.747 | 936.739 | -6,2% | 5,7% | 6,1% | 4 |
6 | Mercedes-Benz | 877.988 | 906.385 | -3,1% | 5,7% | 5,9% | 6 |
7 | BMW | 817.354 | 823.587 | -0,8% | 5,3% | 5,3% | 8 |
8 | Audi | 713.868 | 823.689 | -13,3% | 4,6% | 5,3% | 7 |
9 | Skoda | 699.654 | 693.702 | 0,9% | 4,5% | 4,5% | 10 |
10 | Toyota | 698.688 | 675.620 | 3,4% | 4,5% | 4,4% | 11 |
11 | Fiat | 697.977 | 769.670 | -9,3% | 4,5% | 5,0% | 9 |
12 | Citroën | 590.886 | 566.041 | 4,4% | 3,8% | 3,7% | 12 |
13 | Hyundai | 532.886 | 512.834 | 3,9% | 3,5% | 3,3% | 14 |
14 | Dacia | 522.793 | 460.891 | 13,4% | 3,4% | 3,0% | 15 |
15 | Kia | 488.495 | 459.758 | 6,3% | 3,2% | 3,0% | 16 |
16 | Nissan | 487.017 | 560.415 | -13,1% | 3,2% | 3,6% | 13 |
17 | Seat | 443.831 | 397.301 | 11,7% | 2,9% | 2,6% | 17 |
18 | Volvo | 319.048 | 301.240 | 5,9% | 2,1% | 1,9% | 18 |
19 | Suzuki | 245.653 | 240.875 | 2,0% | 1,6% | 1,6% | 19 |
20 | Mazda | 231.070 | 227.784 | 1,4% | 1,5% | 1,5% | 20 |
21 | Mini | 216.948 | 215.549 | 0,6% | 1,4% | 1,4% | 21 |
22 | Jeep | 165.058 | 107.569 | 53,4% | 1,1% | 0,7% | 25 |
23 | Land Rover | 150.283 | 167.943 | -10,5% | 1,0% | 1,1% | 22 |
24 | Mitsubishi | 138.936 | 112.994 | 23,0% | 0,9% | 0,7% | 24 |
25 | Honda | 136.191 | 140.430 | -3,0% | 0,9% | 0,9% | 23 |
26 | Smart | 97.346 | 100.058 | -2,7% | 0,6% | 0,6% | 26 |
27 | Jaguar | 84.311 | 68.590 | 22,9% | 0,5% | 0,4% | 29 |
28 | Alfa Romeo | 83.438 | 86.805 | -3,9% | 0,5% | 0,6% | 27 |
29 | Porsche | 68.352 | 72.834 | -6,2% | 0,4% | 0,5% | 28 |
30 | Lancia | 48.609 | 60.620 | -19,8% | 0,3% | 0,4% | 30 |
31 | Lexus | 46.170 | 44.964 | 2,7% | 0,3% | 0,3% | 32 |
32 | DS | 45.251 | 45.863 | -1,3% | 0,3% | 0,3% | 31 |
33 | Subaru | 36.688 | 35.297 | 3,9% | 0,2% | 0,2% | 33 |
34 | Tesla | 29.614 | 27.986 | 5,8% | 0,2% | 0,2% | 34 |
35 | SSangYong | 14.767 | 17.221 | -14,3% | 0,1% | 0,1% | 35 |
36 | SAIC MG | 9.050 | 4.442 | 103,7% | 0,1% | 0,0% | 39 |
37 | Maserati | 8.074 | 9.668 | -16,5% | 0,1% | 0,1% | 37 |
38 | Infiniti | 6.250 | 12.571 | -50,3% | 0,0% | 0,1% | 36 |
39 | Lada | 5.325 | 5.342 | -0,3% | 0,0% | 0,0% | 38 |
40 | Ferrari | 3.382 | 2.922 | 15,7% | 0,0% | 0,0% | 41 |
41 | Bentley | 3.135 | 3.912 | -19,9% | 0,0% | 0,0% | 40 |
42 | Chevrolet | 2.418 | 2.398 | 0,8% | 0,0% | 0,0% | 43 |
43 | Aston Martin | 2.296 | 2.484 | -7,6% | 0,0% | 0,0% | 42 |
44 | Alpine | 1.950 | 7 | New | 0,0% | 0,0% | 54 |
45 | Lamborghini | 1.679 | 1.005 | 67,1% | 0,0% | 0,0% | 44 |
46 | Dodge | 1.301 | 737 | 76,5% | 0,0% | 0,0% | 48 |
47 | DR Motor | 1.225 | 415 | 195,2% | 0,0% | 0,0% | 50 |
48 | Mahindra | 1.054 | 430 | 145,1% | 0,0% | 0,0% | 49 |
49 | Cadillac | 1.003 | 916 | 9,5% | 0,0% | 0,0% | 45 |
50 | Rolls Royce | 716 | 742 | -3,5% | 0,0% | 0,0% | 47 |
51 | Lotus | 584 | 783 | -25,4% | 0,0% | 0,0% | 46 |
52 | Geely | 151 | 240 | -37,1% | 0,0% | 0,0% | 51 |
53 | Chrysler | 149 | 85 | 75,3% | 0,0% | 0,0% | 52 |
54 | Borgward* | 35 | 0 | New | 0,0% | 0,0% | 55 |
55 | Bugatti | 22 | 16 | 37,5% | 0,0% | 0,0% | 53 |
*estimate
European car sales statistics are from the following countries: Austria, Belgium, Bulgaria, Croatia, Cyprus, Czech Republic, Denmark, Estonia, Finland, France, Germany, Greece, Hungary, Iceland, Ireland, Italy, Latvia, Lithuania, Luxembourg, Netherlands, Norway, Poland, Portugal, Romania, Slovakia, Slovenia, Spain, Sweden, Switzerland, United Kingdom. They exclude vehicles registered as commercial vehicles. Source: ANDC, JATO Dynamics