
Volvo XC40
Here you will find monthly and yearly Canadian, U.S, European and Chinese market sales figures for the Volvo XC40. The Volvo XC40 is a compact luxury crossover SUV that was introduced in 2017. It is the smallest SUV in Volvo’s lineup. Overall, the Volvo XC40 is a stylish and practical compact luxury SUV that is a good choice for those who are looking for a car with a premium feel and advanced safety features. It is not as affordable as some rivals, but it is a good value for the money.
Volvo XC40 Overview
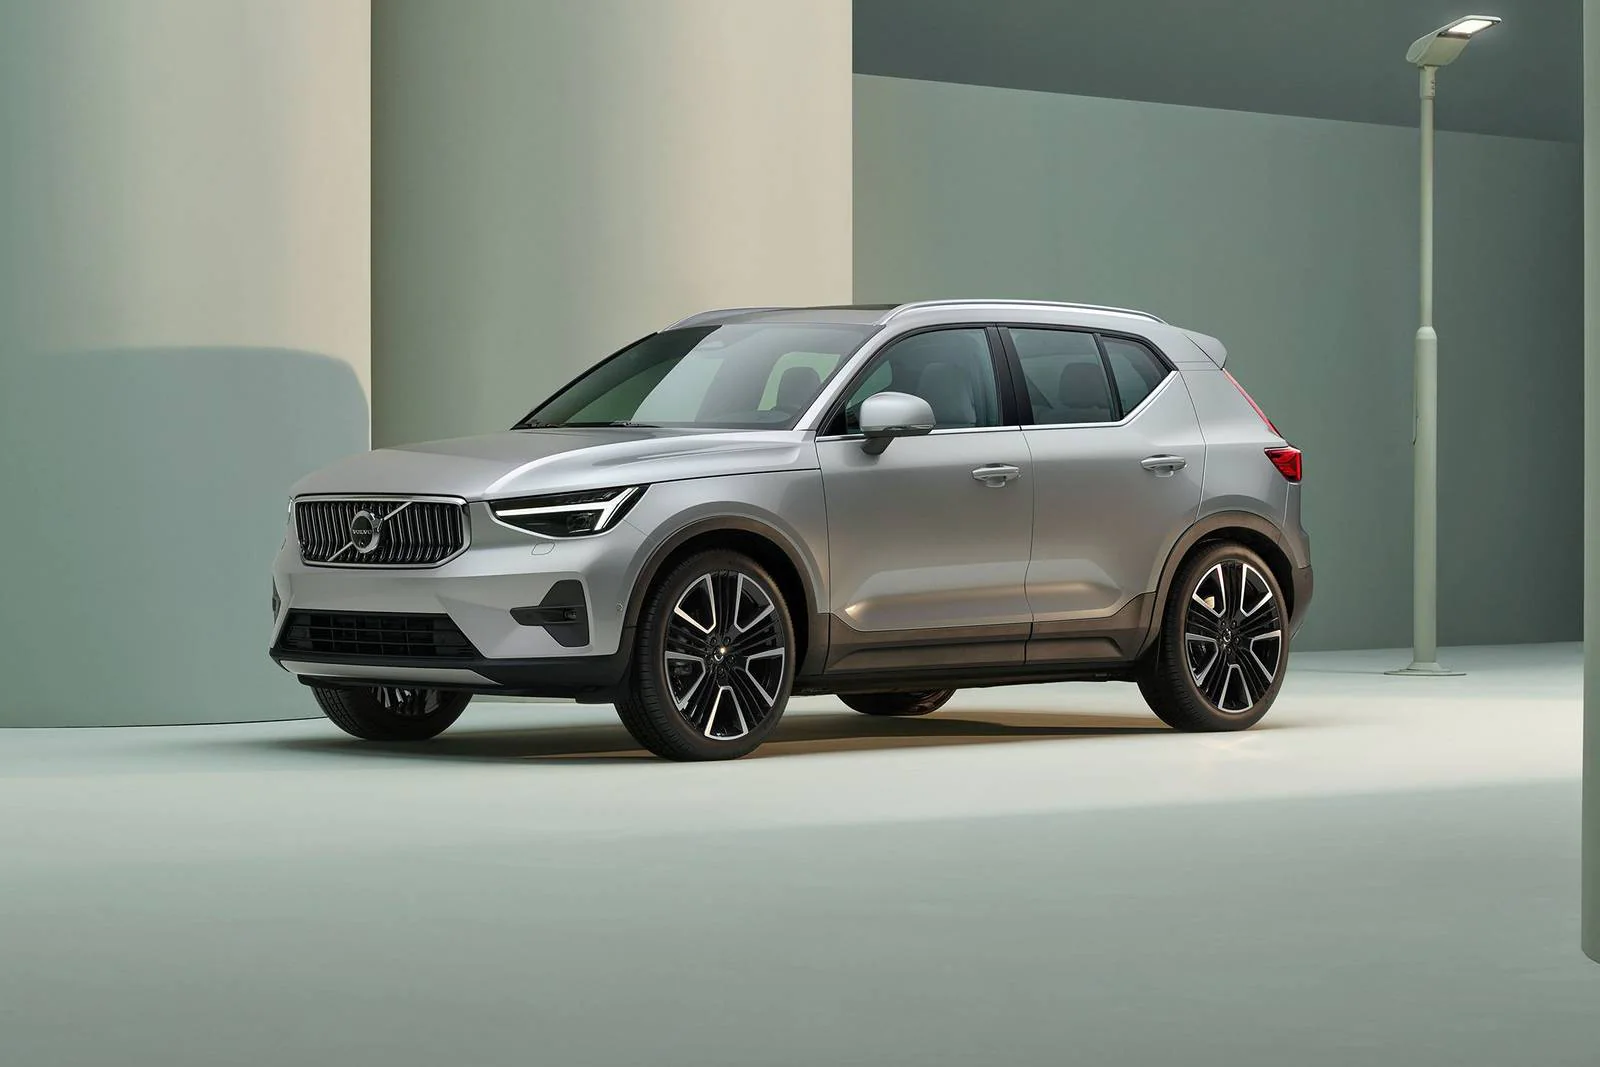
The Volvo XC40 is a compact luxury SUV introduced by the Swedish automaker Volvo Cars in 2017. It’s the smallest SUV in Volvo’s lineup, sitting below the mid-size XC60 and the larger XC90. The XC40 marked Volvo’s entry into the subcompact luxury SUV segment, competing with vehicles like the BMW X1, Audi Q3, and Mercedes-Benz GLA.
The XC40 sports a distinctive, modern design with a slightly boxier and more youthful appearance compared to its larger siblings, the XC60 and XC90. It’s built on the Compact Modular Architecture (CMA) platform, which Volvo co-developed with Geely, its parent company. Depending on the market, the XC40 offers a range of powertrains, including gasoline engines, diesel engines (primarily for certain European markets), a plug-in hybrid version known as the XC40 Recharge T5 and an all-electric variant, also named the XC40 Recharge, but distinct from the T5 model, as it’s fully electric.
The XC40’s interior design mirrors the modern and minimalist Scandinavian ethos seen in other Volvo models. It comes with a host of standard and available features, including a 9-inch touchscreen infotainment system, Apple CarPlay, Android Auto, and a range of safety features – given Volvo’s longstanding focus on safety.
The all-electric version of the XC40, known as the XC40 Recharge, is a significant step in Volvo’s commitment to electrify its lineup. With a competitive range and impressive performance figures, the XC40 Recharge aims to make a mark in the growing luxury EV segment.
Volvo XC40 Sales Figures
The XC40 has been well-received since its launch, garnering praise for its design, features, and safety tech. It’s also been recognized with several awards, including the 2018 European Car of the Year. The XC40 is available in numerous markets worldwide, including North America, Europe, Asia, and others. Its versatile range of powertrains ensures it caters to various market preferences and regulations.
Volvo XC40 U.S Sales Data & Charts
US Monthly Sales
US Annual Sales
| Year | sold |
|---|---|
| 2018 | 12,420 |
| 2019 | 17,647 |
| 2020 | 23,778 |
| 2021 | 26,802 |
| 2022 | 18,558 |
| 2023 | 28,143 |
| 2024 | 7,316 |
US Annual Growth
Volvo XC40 Canada Sales Data & Charts
Canada Annual Sales
| Year | sold |
|---|---|
| 2018 | 1,252 |
| 2019 | 2,132 |
| 2020 | 2,254 |
| 2021 | 3,296 |
Canada Annual Growth
Volvo XC40 Europe Sales Data & Charts
Europe Annual Sales
| Year | Sales Units |
|---|---|
| 2017 | 117 |
| 2018 | 47,298 |
| 2019 | 82,457 |
| 2020 | 110,254 |
| 2021 | 123,847 |
| 2022 | 98,781 |
Europe Annual Growth
Volvo XC40 China Sales Data & Charts
Car sales statistics from China only include domestic production and exclude imported models.
China Annual Sales
| Year | Sales Units |
|---|---|
| 2019 | 13,216 |
| 2020 | 23,982 |
| 2021 | 14,244 |
| 2022 | 15,979 |


