
SSangYong Sales Data, Trends & Analysis for the European Automotive Market
SsangYong sales and market share in Europe have steadily declined from its peak in 2006 to 2013, before rebounding in the following years, although the brand is still at just half the market share it held in 2006 and remains a niche player with 0,11% share. The South-Korean SUV-maker has been bought out of bankruptcy-protection by Indian automaker Mahindra in 2011.
SSangYong Europe Sales Figures & Recent Highlights
The brand’s brand’s best selling model is the Tivoli small crossover, which peaked above 10.000 sales in its first full year 2016, more than the entire brand had sold between 2008 and its launch in 2015. A stretched version which only offers a larger luggage space but no third row option is called XLV is less successful.
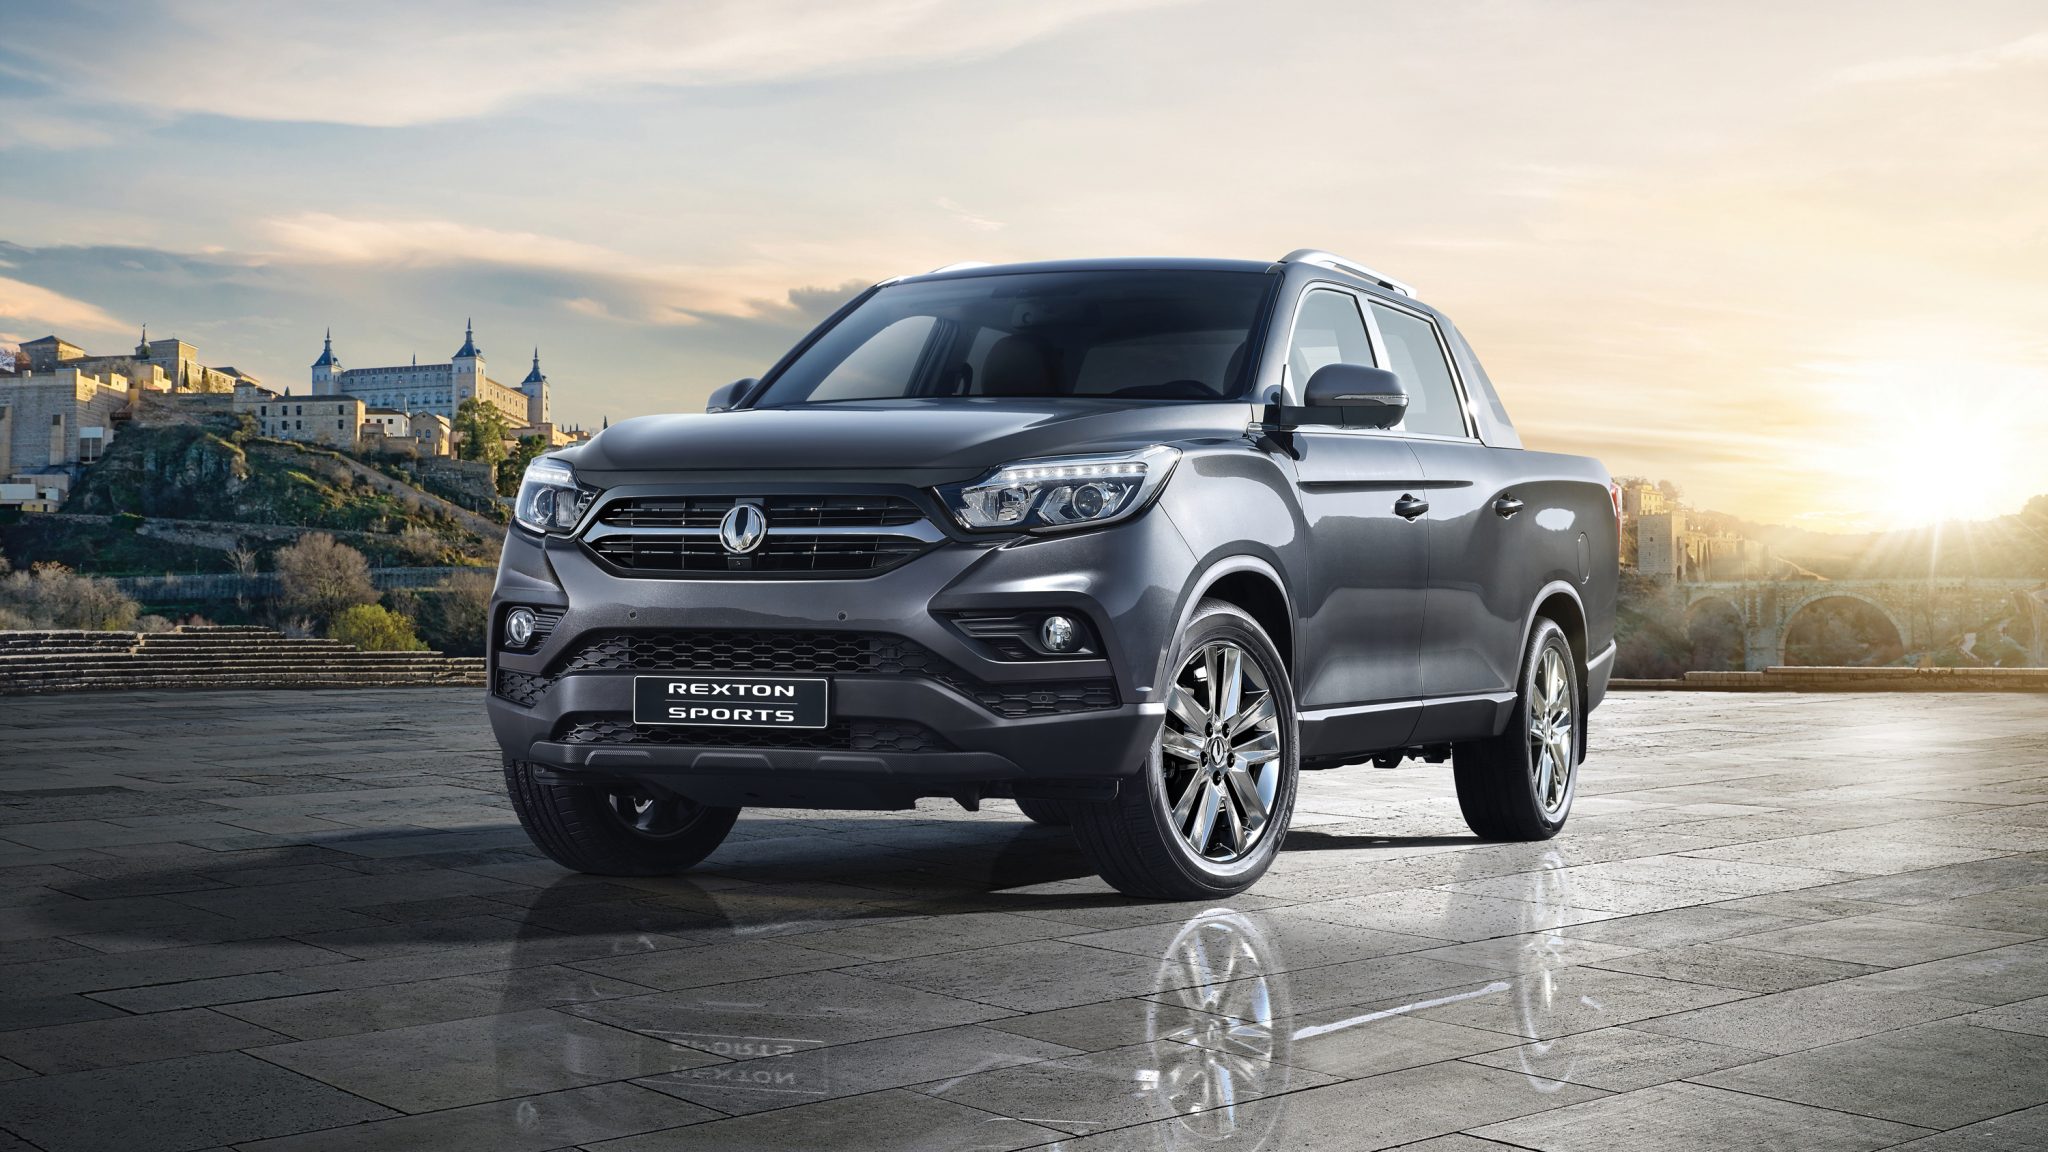
The Korando compact crossover is the #2 best selling SsangYong in Europe but is an absolute wallflower in its class. The Korando is a competitor to the Kia Sportage and Hyundai Tucson, but low brand recognition and small dealer network leave the model lagging far behind in sales. In 2017 the brand launched the new generation of its Rexton large SUV and although this segment as a whole has shrunk considerably in the past decade, the Rexton name still has a good recognition within specific target audiences, especially those who need a no-frills but capable work horse, one that offers great towing capacity and off-road capabilities. Considering its competition is largely limited to the Toyota Land Cruiser and the antediluvian Mitsubishi Pajero, the Koreans may carve out an interesting niche for themselves.
SsangYong’s least successful model is the Rodius large MPV whose first generation is often named among the ugliest cars ever made, alongside the Fiat Multipla and Pontiac Aztek. Its second generation is not much of a looker either, but remains one of the largest cars in its class. Also the least popular, though. And that’s quite a sad result in one of the fastest shrinking segments in Europe.
SSangYong Annual Sales Data and Market Share in Europe
Below we have a table that shows total SSangYong sales volumes for the European automotive market, broken out by year. This data captures all SSangYong vehicle sales for the entire European automotive market.
| Year | Sales | Growth | Market Share |
|---|---|---|---|
| 1997 | 7,016 | 0.00 | 0.05 |
| 1998 | 7,253 | 3.38 | 0.05 |
| 1999 | 6,151 | -15.19 | 0.04 |
| 2000 | 4,116 | -33.08 | 0.03 |
| 2001 | 1,534 | -62.73 | 0.01 |
| 2002 | 1,519 | -0.98 | 0.01 |
| 2003 | 2,160 | 42.20 | 0.01 |
| 2004 | 10,104 | 367.78 | 0.06 |
| 2005 | 23,656 | 134.13 | 0.15 |
| 2006 | 32,840 | 38.82 | 0.21 |
| 2007 | 23,609 | -28.11 | 0.15 |
| 2008 | 9,700 | -58.91 | 0.07 |
| 2009 | 8,388 | -13.53 | 0.06 |
| 2010 | 6,973 | -16.87 | 0.05 |
| 2011 | 7,695 | 10.35 | 0.06 |
| 2012 | 5,563 | -27.71 | 0.04 |
| 2013 | 5,465 | -1.76 | 0.04 |
| 2014 | 8,190 | 49.86 | 0.06 |
| 2015 | 14,264 | 74.16 | 0.10 |
| 2016 | 19,082 | 33.78 | 0.13 |
| 2017 | 17,221 | -9.75 | 0.11 |
| 2018 | 14,767 | -14.25 | 0.10 |
| 2019 | 13,417 | -9.14 | 0.09 |
| 2020 | 9,555 | -28.78 | 0.08 |
| 2021 | 9,626 | 0.74 | 0.08 |
SSangYongEurope Annual Sales Units & Growth Chart
Below is a visual representation of SSangYong Europe sales units over time. We have both the SSangYong‘s sales units and the market share in the European market. Click on the items in the legend to see each series by itself.


