
Rolls Royce Cullinan
The world’s most expensive SUV is the Rolls-Royce Cullinan, and it’s every bit as opulent as you would hope. Introduced for 2019, the Cullinan quickly became Rolls-Royce’s bestseller, combining the ultimate quietude and serene ride of the Phantom with the spacious cargo hold and elevated ride height of a crossover.
Rolls Royce Cullinan Overview
The Rolls-Royce Cullinan is a luxury SUV introduced by Rolls-Royce Motor Cars in 2019. Named after the Cullinan Diamond, the largest gem-quality rough diamond ever discovered, this vehicle marked Rolls-Royce’s first foray into the SUV market. It’s positioned as one of the most luxurious and expensive SUVs available, melding off-road capability with the brand’s hallmark opulence.
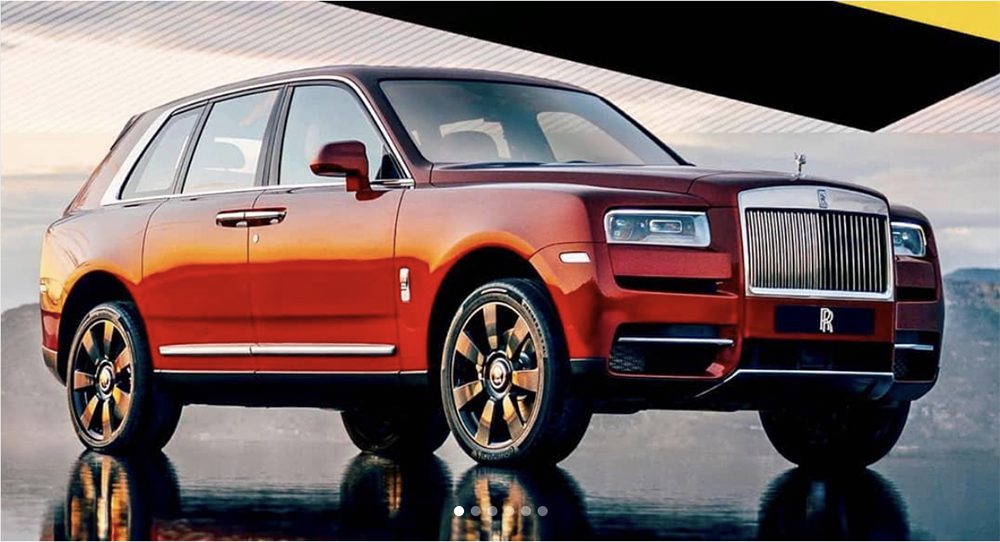
The Cullinan’s design integrates the iconic Rolls-Royce features, such as the Pantheon grille and the Spirit of Ecstasy hood ornament, into an SUV form. The vehicle boasts suicide doors (also known as coach doors), which have become synonymous with Rolls-Royce models. Inside, the Cullinan offers a lavish environment with high-end materials like leather, wood, and metal throughout. The attention to detail is meticulous, as expected from Rolls-Royce.
The Cullinan is powered by a 6.75-liter twin-turbocharged V12 engine that produces 563 horsepower and 627 lb-ft of torque. It is available with a choice of rear-wheel drive or all-wheel drive. Despite its size and weight, the vehicle provides a serene and near-silent driving experience, thanks to sound-deadening materials and active noise cancellation.
The Cullinan is available in two trim levels: the base Cullinan and the Cullinan Black Badge. The Black Badge trim adds features like a more powerful engine, a darker exterior, and a more luxurious interior. The Cullinan offers numerous bespoke options, allowing owners to customize the vehicle to their exact specifications.
Rolls Royce Cullinan Sales Figures
The Cullinan is Rolls-Royce’s answer to the growing demand for luxury SUVs, a segment that has seen entries from many high-end brands. It competes with the likes of the Bentley Bentayga, Lamborghini Urus, and the Range Rover SV Autobiography, but the Cullinan often sits at a higher price point and offers a unique blend of bespoke luxury.
Rolls Royce Cullinan Europe Sales Data & Charts
Europe Annual Sales
Year Sales Units
2018
67
2019
406
2020
303
2021
269
2022
529
Europe Annual Growth


