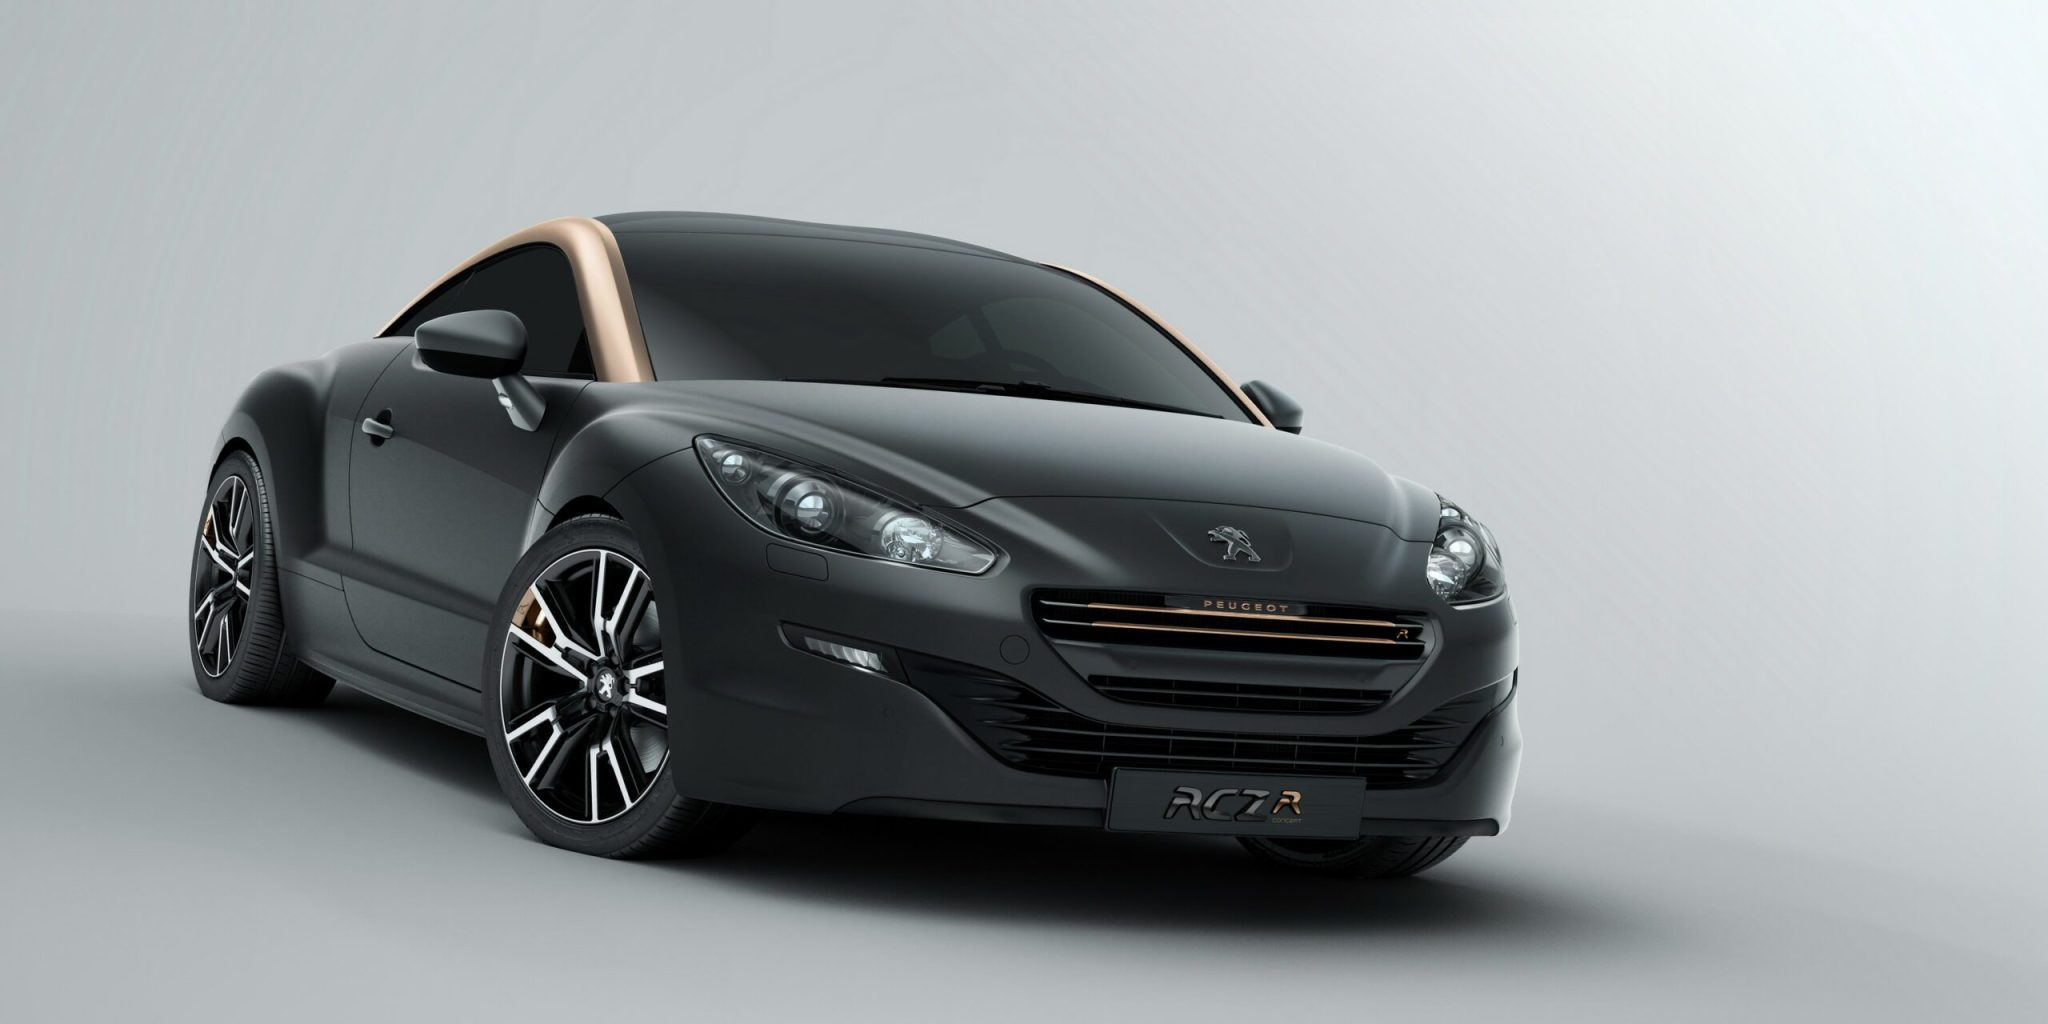
Monthly and annual sales figures for the Peugeot RCZ in Europe.
|
Peugeot
RCZ
2016
|
Peugeot
RCZ
2017
|
January |
98 |
2 |
February |
58 |
1 |
March |
124 |
|
April |
46 |
2 |
May |
62 |
2 |
June |
36 |
1 |
July |
23 |
|
August |
25 |
1 |
September |
3 |
|
October |
1 |
1 |
November |
6 |
|
December |
3 |
|
|
Peugeot
RCZ
|
2017 |
10 |
2016 |
485 |
2015 |
4.190 |
2014 |
5.796 |
2013 |
7.440 |
2012 |
9.585 |
2011 |
15.343 |
2010 |
11.587 |
2009 |
88 |
Use the dropdown at the top right of this page to find sales figures for any other car model sold in Europe since the early 2000’s. Car sales statistics are from the following countries: Austria, Belgium, Cyprus, Czech Republic, Denmark, Estonia, Finland, France, Germany, Great Britain, Greece, Hungary, Iceland, Ireland, Italy, Latvia, Lithuania, Luxembourg, Netherlands, Norway, Poland, Portugal, Romania, Slovakia, Slovenia, Spain, Sweden, Switzerland. Sources: Manufacturers, ANDC, JATO Dynamics.
|
Peugeot
RCZ
2016
|
Peugeot
RCZ
2017
|
January |
98 |
2 |
February |
58 |
1 |
March |
124 |
|
April |
46 |
2 |
May |
62 |
2 |
June |
36 |
1 |
July |
23 |
|
August |
25 |
1 |
September |
3 |
|
October |
1 |
1 |
November |
6 |
|
December |
3 |
|
|
Peugeot
RCZ
|
2017 |
10 |
2016 |
485 |
2015 |
4.190 |
2014 |
5.796 |
2013 |
7.440 |
2012 |
9.585 |
2011 |
15.343 |
2010 |
11.587 |
2009 |
88 |