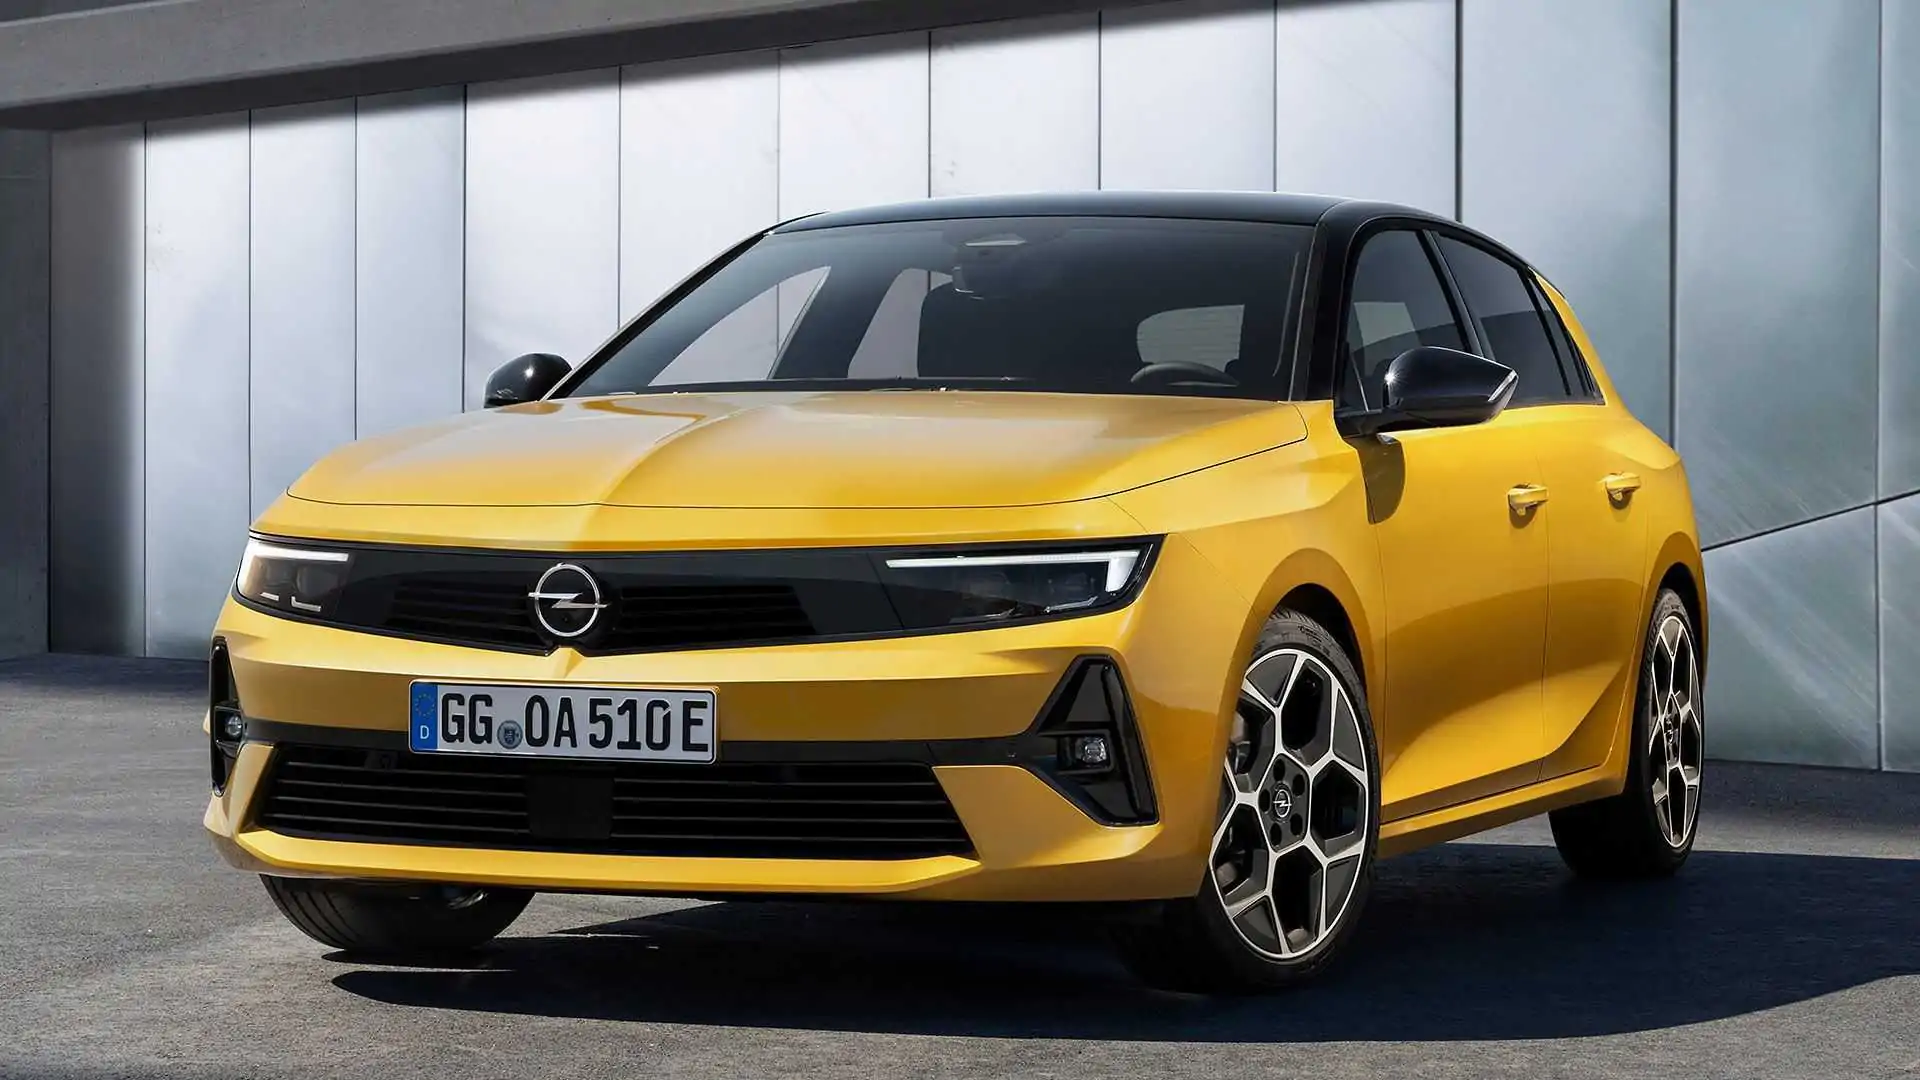
Monthly and annual sales figures for the Opel / Vauxhall Astra in Europe.
Related models: Peugeot 308, DS4.
See how Opel / Vauxhall Astra sales compare to the other models in the compact car segment.
Opel/VauxhallAstra2016 |
Opel/VauxhallAstra2017 |
Opel/VauxhallAstra2018 |
Opel/VauxhallAstra2019 |
Opel/VauxhallAstra2020 |
Opel/VauxhallAstra2021 |
Opel/VauxhallAstra2022 |
|
January | 16.873 | 20.704 | 13.558 | 12.450 | 6.616 | 5.187 | 2.264 |
February | 16.493 | 18.118 | 12.173 | 9.048 | 7.515 | 3.570 | 2.837 |
March | 27.638 | 31.301 | 19.932 | 16.003 | 5.789 | 6.062 | 3.162 |
April | 19.927 | 18.140 | 13.038 | 10.083 | 2.582 | 4.971 | |
May | 20.498 | 20.273 | 13.196 | 12.312 | 4.563 | 5.963 | |
June | 26.543 | 24.152 | 16.431 | 11.758 | 6.563 | 6.506 | |
July | 20.751 | 15.008 | 13.574 | 12.042 | 6.139 | 5.025 | |
August | 14.031 | 12.085 | 11.086 | 9.607 | 3.569 | 3.669 | |
September | 25.149 | 15.948 | 11.571 | 13.733 | 7.067 | 5.714 | |
October | 20.410 | 13.722 | 11.794 | 11.567 | 7.135 | 4.213 | |
November | 20.709 | 14.344 | 11.831 | 12.677 | 6.972 | 4.487 | |
December | 21.388 | 12.720 | 10.490 | 5.358 | 6.040 | 2.696 |
Opel/VauxhallAstra |
|
2021 | 58.063 |
2020 | 70.550 |
2019 | 136.638 |
2018 | 158.674 |
2017 | 216.515 |
2016 | 250.410 |
2015 | 192.973 |
2014 | 179.547 |
2013 | 198.449 |
2012 | 237.297 |
2011 | 302.215 |
2010 | 302.482 |
2009 | 280.599 |
2008 | 334.036 |
2007 | 415.509 |
2006 | 452.881 |
2005 | 512.116 |
2004 | 409.535 |
2003 | 350.385 |
2002 | 432.198 |
2001 | 517.519 |
2000 | 560.226 |
1999 | 670.547 |
1998 | 558.542 |
1997 | 498.753 |
Previous generations:
- 1991-1998 Astra F
- 1998-2004 Astra G
- 2004-2009 Astra H (Related model: Saturn Astra, US)
- 2009-2015 Astra J
- 2015-2020 Astra K (Related models: Chevrolet Cruze, Buick Verano (US), Buick Excelle XT/GT (China).
Astra GTC sales figures (also included in above figures):
Astra GTC | |
2011 | 9.195 |
2012 | 27.581 |
2013 | 18.862 |
2014 | 15.068 |
2015 | 11.707 |
2016 | 6.971 |
Use the dropdown at the top right of this page to find sales figures for any other car model sold in Europe since the early 2000’s.
Car sales statistics are from the following countries: Austria, Belgium, Cyprus, Czech Republic, Denmark, Estonia, Finland, France, Germany, Great Britain, Greece, Hungary, Iceland, Ireland, Italy, Latvia, Lithuania, Luxembourg, Netherlands, Norway, Poland, Portugal, Romania, Slovakia, Slovenia, Spain, Sweden, Switzerland. Sources: Manufacturers, ANDC, JATO Dynamics.
Opel/VauxhallAstra2016 |
Opel/VauxhallAstra2017 |
Opel/VauxhallAstra2018 |
Opel/VauxhallAstra2019 |
Opel/VauxhallAstra2020 |
Opel/VauxhallAstra2021 |
Opel/VauxhallAstra2022 |
|
January | 16.873 | 20.704 | 13.558 | 12.450 | 6.616 | 5.187 | 2.264 |
February | 16.493 | 18.118 | 12.173 | 9.048 | 7.515 | 3.570 | 2.837 |
March | 27.638 | 31.301 | 19.932 | 16.003 | 5.789 | 6.062 | 3.162 |
April | 19.927 | 18.140 | 13.038 | 10.083 | 2.582 | 4.971 | |
May | 20.498 | 20.273 | 13.196 | 12.312 | 4.563 | 5.963 | |
June | 26.543 | 24.152 | 16.431 | 11.758 | 6.563 | 6.506 | |
July | 20.751 | 15.008 | 13.574 | 12.042 | 6.139 | 5.025 | |
August | 14.031 | 12.085 | 11.086 | 9.607 | 3.569 | 3.669 | |
September | 25.149 | 15.948 | 11.571 | 13.733 | 7.067 | 5.714 | |
October | 20.410 | 13.722 | 11.794 | 11.567 | 7.135 | 4.213 | |
November | 20.709 | 14.344 | 11.831 | 12.677 | 6.972 | 4.487 | |
December | 21.388 | 12.720 | 10.490 | 5.358 | 6.040 | 2.696 |
Opel/VauxhallAstra |
|
2021 | 58.063 |
2020 | 70.550 |
2019 | 136.638 |
2018 | 158.674 |
2017 | 216.515 |
2016 | 250.410 |
2015 | 192.973 |
2014 | 179.547 |
2013 | 198.449 |
2012 | 237.297 |
2011 | 302.215 |
2010 | 302.482 |
2009 | 280.599 |
2008 | 334.036 |
2007 | 415.509 |
2006 | 452.881 |
2005 | 512.116 |
2004 | 409.535 |
2003 | 350.385 |
2002 | 432.198 |
2001 | 517.519 |
2000 | 560.226 |
1999 | 670.547 |
1998 | 558.542 |
1997 | 498.753 |