Here you will find monthly and yearly Chinese, Canadian, European and U.S. sales figures for the Nissan Murano. The Nissan Murano is a mid-size crossover SUV from Nissan. Since its introduction in the early 2000s, it has been recognized for its distinct styling and comfortable interior.
Nissan Murano Overview
The Nissan Murano made its debut in 2002 for the 2003 model year. It was named after the Murano islands near Venice, Italy, which are known for their hand-blown glass. The Murano was designed to combine the functionality of an SUV with the ride comfort and performance of a sedan. Over the years, its design has stood out due to its unique and often avant-garde styling. In Nissan’s lineup, it’s positioned between the smaller Rogue and the larger Pathfinder.
First Generation (2003-2007): The Murano debuted with a 3.5L V6 engine and a Continuously Variable Transmission (CVT). It was built on Nissan’s FF-L platform, shared with vehicles like the Nissan Altima and Maxima.
Second Generation (2009-2014): Introduced with a refreshed design, the second generation also utilized the 3.5L V6, but with improvements in performance and efficiency. The interior saw upgrades in quality and technology.
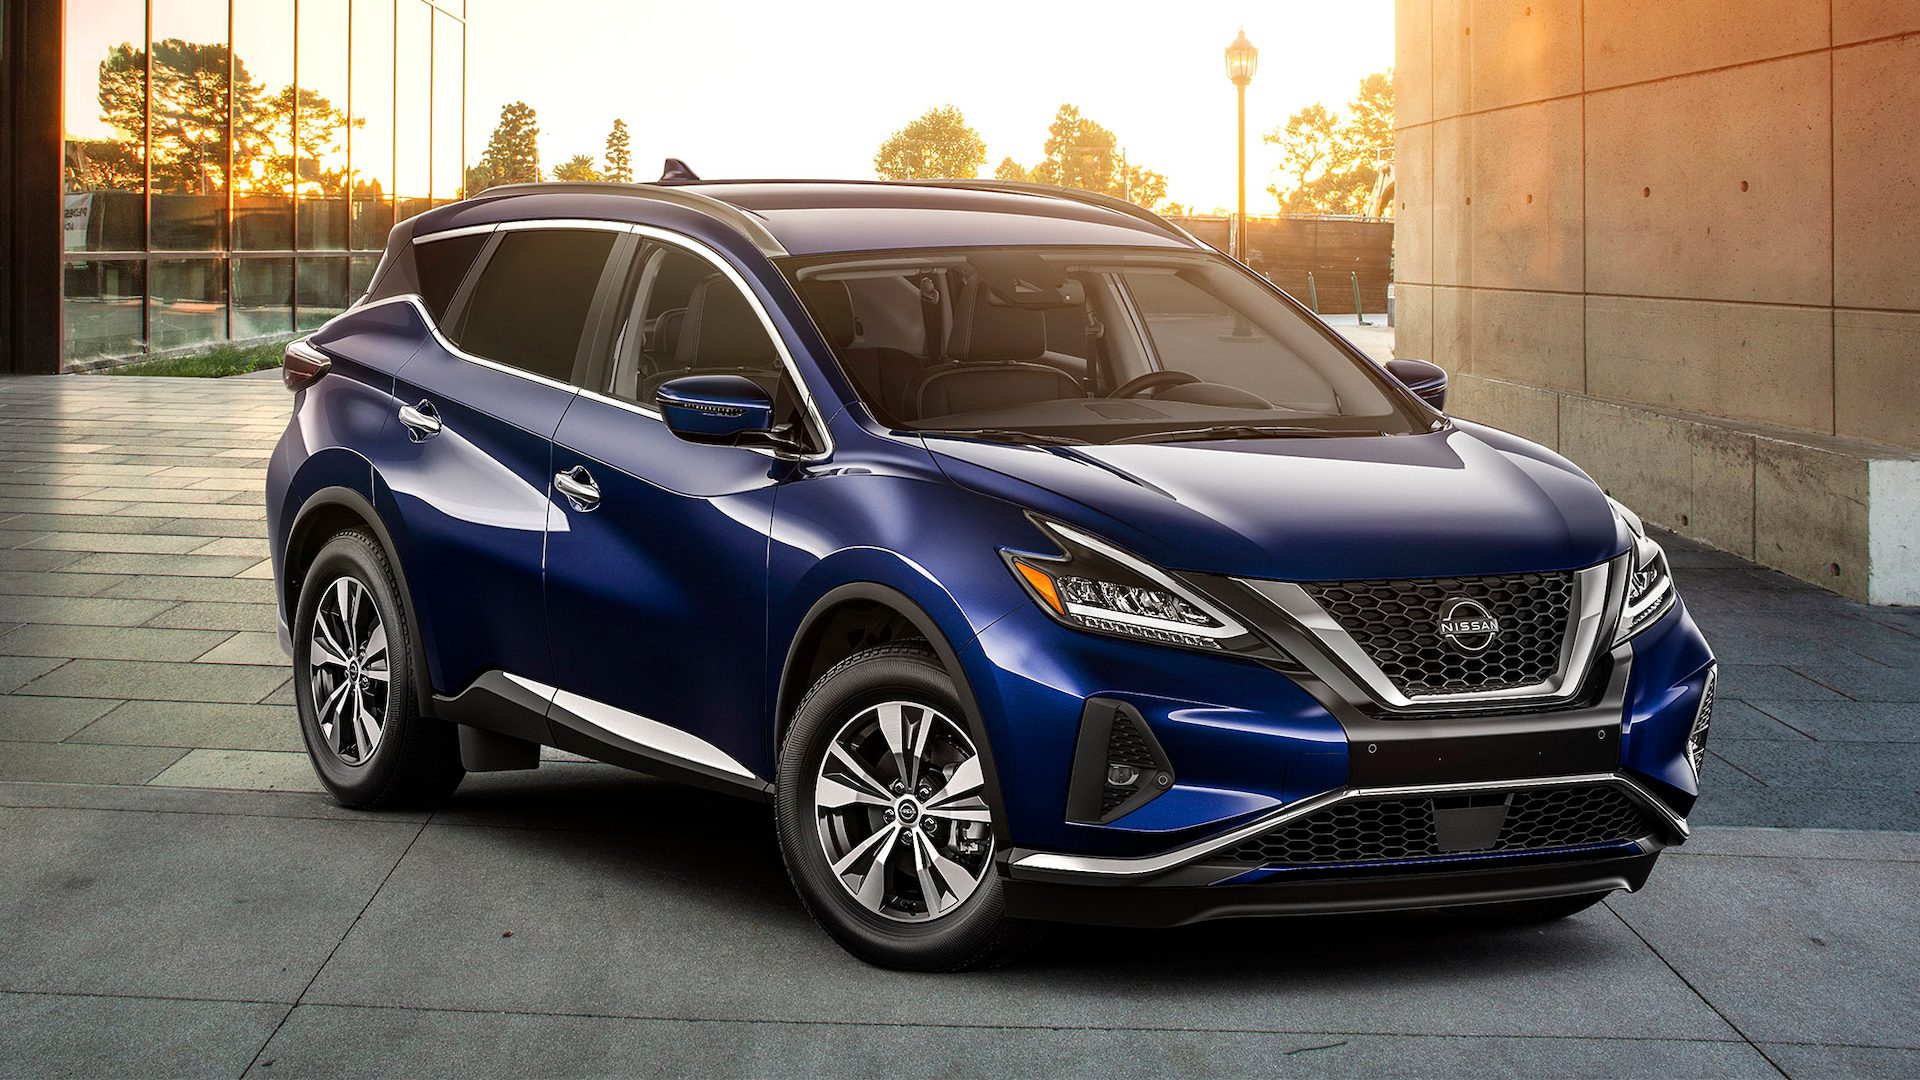
Third Generation (2015-present): Featuring a more futuristic and sculpted design, the third-generation Murano continued to prioritize comfort and technology. It maintained the 3.5L V6 and CVT combination but introduced a host of new tech and safety features.
Nissan Murano Sales Figures
The Nissan Murano has typically been well-received for its comfort and distinct design. Its smooth ride and refined interior often earn it praise. Some critiques over the years have centered on its CVT performance and the infotainment system interface. Within Nissan’s lineup, the Murano offers a more premium experience compared to some of the brand’s entry-level SUVs. It competes in the crowded mid-size SUV segment against vehicles like the Honda Passport, Ford Edge, and Chevrolet Blazer.


I think your article on the NISSAN MURANO CROSSCABRIOLET is full of hooey!
This is a fine car that is totally loaded and to try to pair it against a JEEP WRANGLER shows how stupid your reviews are on cars.
I bought this fine vehicle and I haven't enjoyed a vehicle this much in over 30 years. I would tell all to buy one and enjoy yourselves. I get compliments on this car, everywhere I go! This car blows away my former Cadillac CTS!
Sorry, you and so many others have totally missed the mark on this FUN TO DRIVE and own convertible.
I agree, This CC Convertible is loaded and the only thing that is a negative is the base price is to high and they have should made hard tops, As for the comments that I have seen about useless, and ugly, Well beauty is in the eye of the beholder! The truth!, all convertibles are bought on a personal choice and I bought mine because it was what I preferred, and really "that is all that matters.