
MG 3
The MG3 is a small car produced by the Chinese automotive company SAIC. The first generation, marketed as the MG3 SW, is based on the British made Rover Streetwise, which itself was based on the Rover 25, while the second generation, introduced in 2011 is marketed simply as the MG3. It is the most popular Chinese manufactured car currently on sale in the United Kingdom. The MG 3 is a good value for money hatchback. It offers a comfortable ride, good fuel economy, and a variety of features. It is also available with a manual transmission, which is not available on some of its rivals.
MG 3 Overview
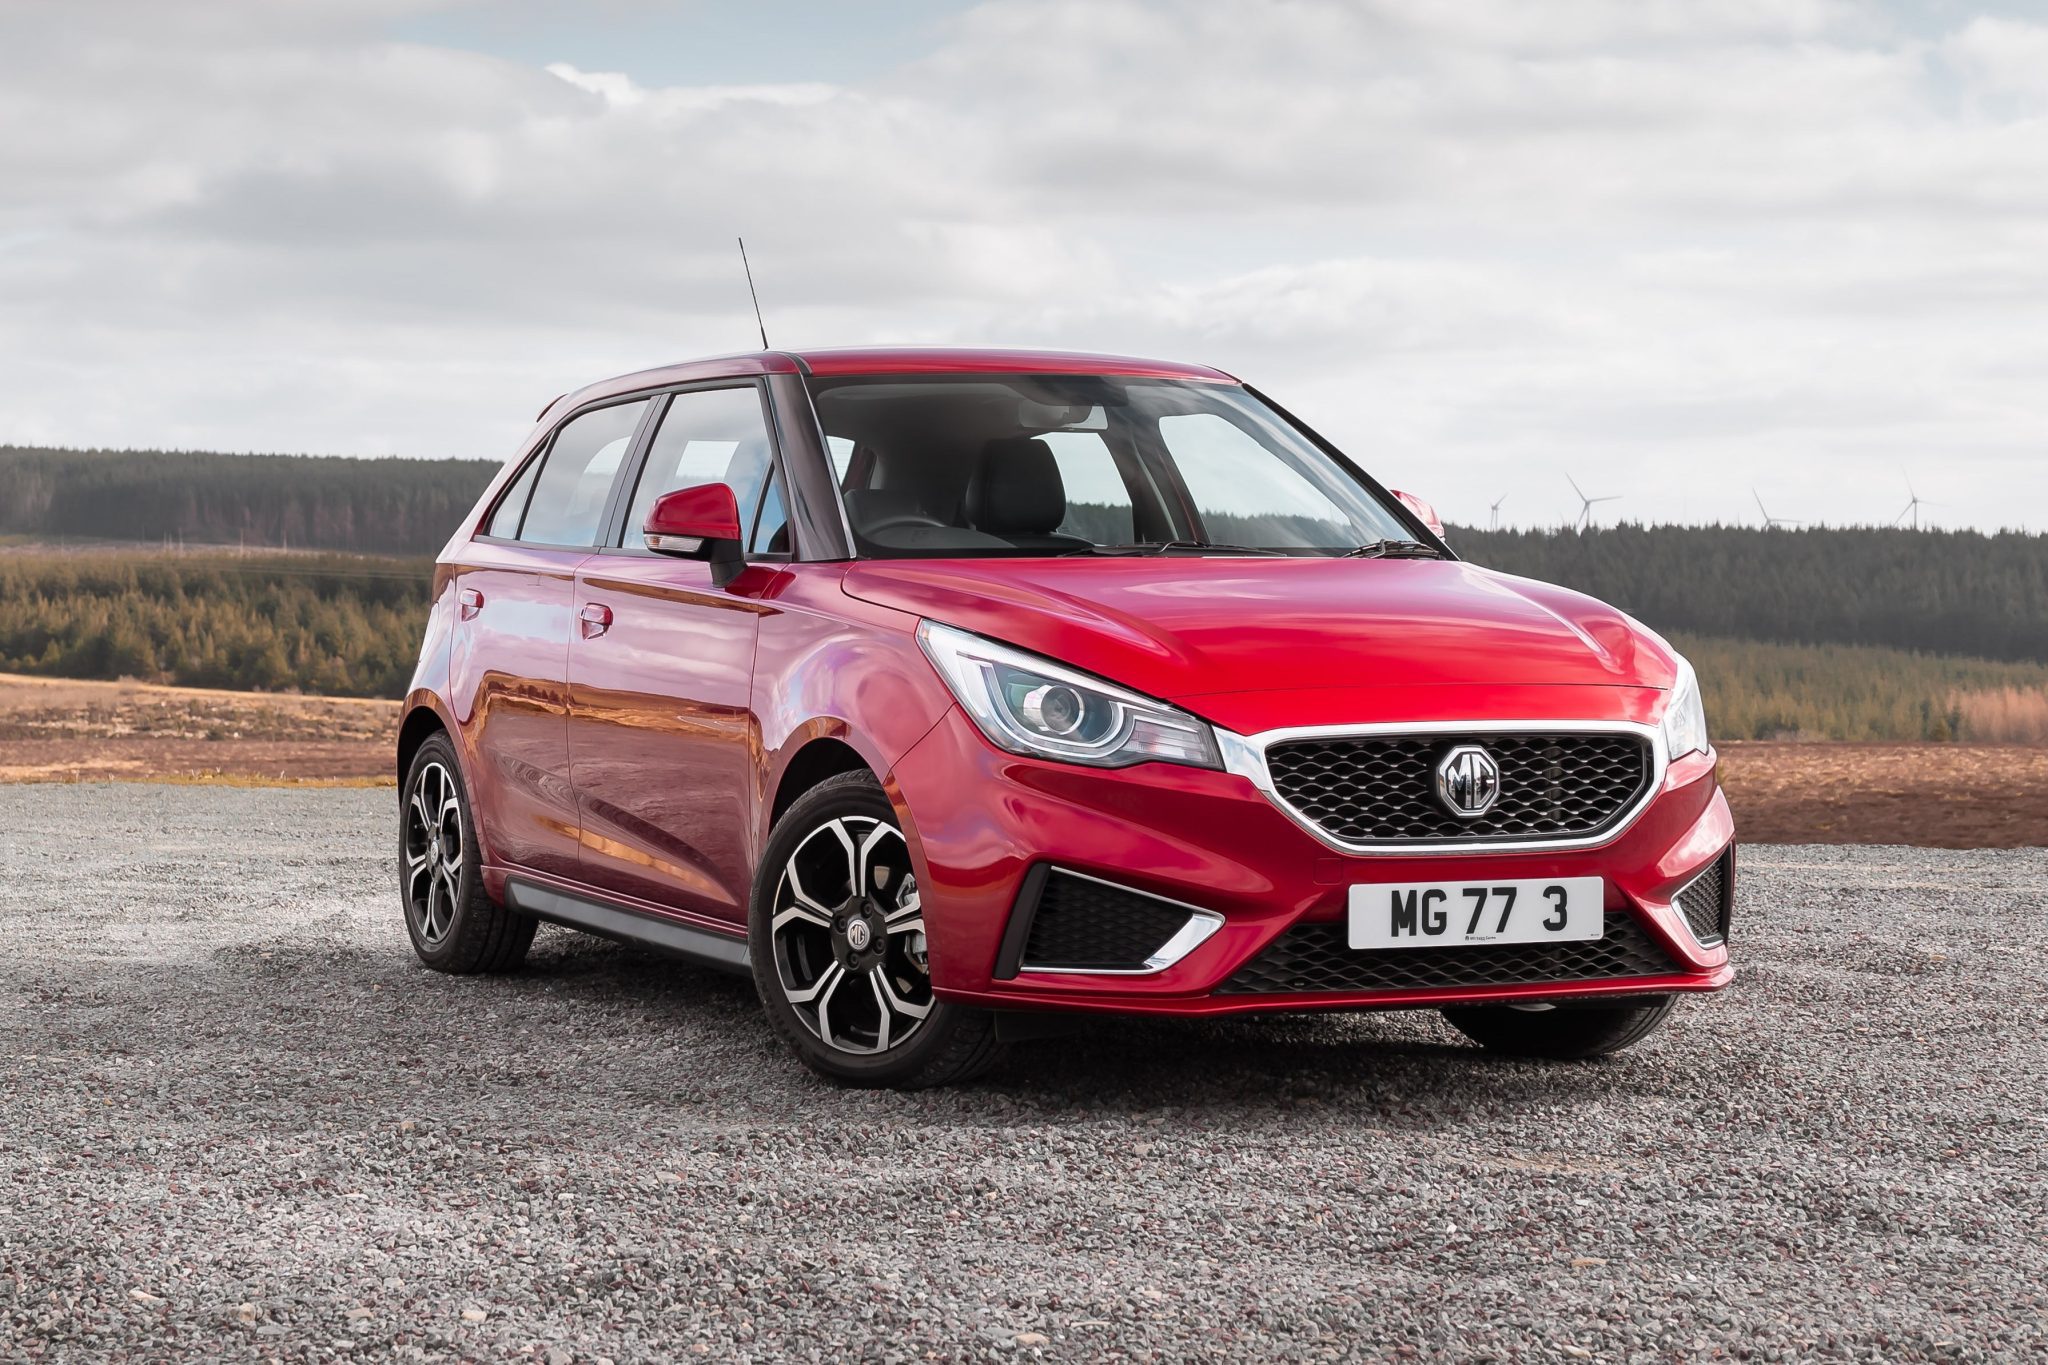
The MG 3 is a supermini car produced by MG Motor, a subsidiary of the Chinese automotive giant SAIC Motor. Originally a British brand with a rich heritage, MG’s resurrection under SAIC brought forth a range of vehicles aiming to cater to various segments in the global market. The MG 3 targeted the compact hatchback segment.
The MG 3 was introduced in 2011 and is part of the brand’s strategy to re-enter various international markets. The car has seen several updates and facelifts since its launch, adapting to evolving consumer expectations. The MG 3 sports a youthful and dynamic design, aiming to attract younger buyers. With its sharp lines and bold features, it presents a modern take on the hatchback style. Inside, the MG 3 offers a relatively spacious interior for its segment, along with modern infotainment options and other features in later models. The car was also marketed with various customization options, allowing buyers to personalize their MG 3 with different color schemes, decals, and more.
The MG 3 has been offered with different engine configurations over its lifespan, primarily focusing on small to mid-sized gasoline engines suitable for urban driving. The car is front-wheel drive and has been available with manual and automatic transmission options, depending on the market and model year.
The current MG 3 is powered by a 1.5-liter naturally-aspirated four-cylinder engine that produces 106 horsepower and 101 lb-ft of torque. It is available with either a 5-speed manual transmission or a 4-speed automatic transmission. The MG 3 is available in two trim levels: the Core and the Excite. The Core is the base trim level and comes standard with features like a 7-inch touchscreen infotainment system, a rearview camera, and cloth seats. The Excite is the top-of-the-line trim level and comes standard with a variety of features, such as a 10.1-inch touchscreen infotainment system, a panoramic sunroof, and leather seats.
The MG 3 is not as well-known as some of its rivals, such as the Ford Fiesta and the Hyundai i20. However, it is a good option for people who are looking for a stylish and affordable hatchback.
MG 3 Sales Figures
The MG 3 has generally received positive feedback for its value proposition. Given its affordable price point, the car offers a decent level of equipment, space, and style. However, some critiques have revolved around its driving dynamics and interior quality, especially when compared to some of its more established competitors in the segment. The MG 3 is a critical model in MG’s lineup, aiming to capture a portion of the high-volume compact hatchback market. It sits below models like the MG 6 in terms of size and pricing.
MG 3 Europe Sales Data & Charts
Europe Annual Sales
| Year | Sales Units |
|---|---|
| 2013 | 209 |
| 2014 | 1,628 |
| 2015 | 2,603 |
| 2016 | 3,243 |
| 2017 | 3,093 |
| 2018 | 2,692 |
| 2019 | 3,820 |
| 2020 | 2,547 |
| 2021 | 2,018 |
| 2022 | 4,375 |
Europe Annual Growth
MG3 China Sales Data & Charts
China Annual Sales
| Year | Sales Units |
|---|---|
| 2008 | 4,715 |
| 2009 | 10,111 |
| 2010 | 8,010 |
| 2011 | 22,714 |
| 2012 | 40,628 |
| 2013 | 45,446 |
| 2014 | 27,864 |
| 2015 | 14,692 |
| 2016 | 11,828 |
| 2017 | 9,987 |
| 2018 | 17,068 |
| 2019 | 22,466 |
| 2020 | 20,211 |
| 2021 | 30,482 |
| 2022 | 9,657 |


