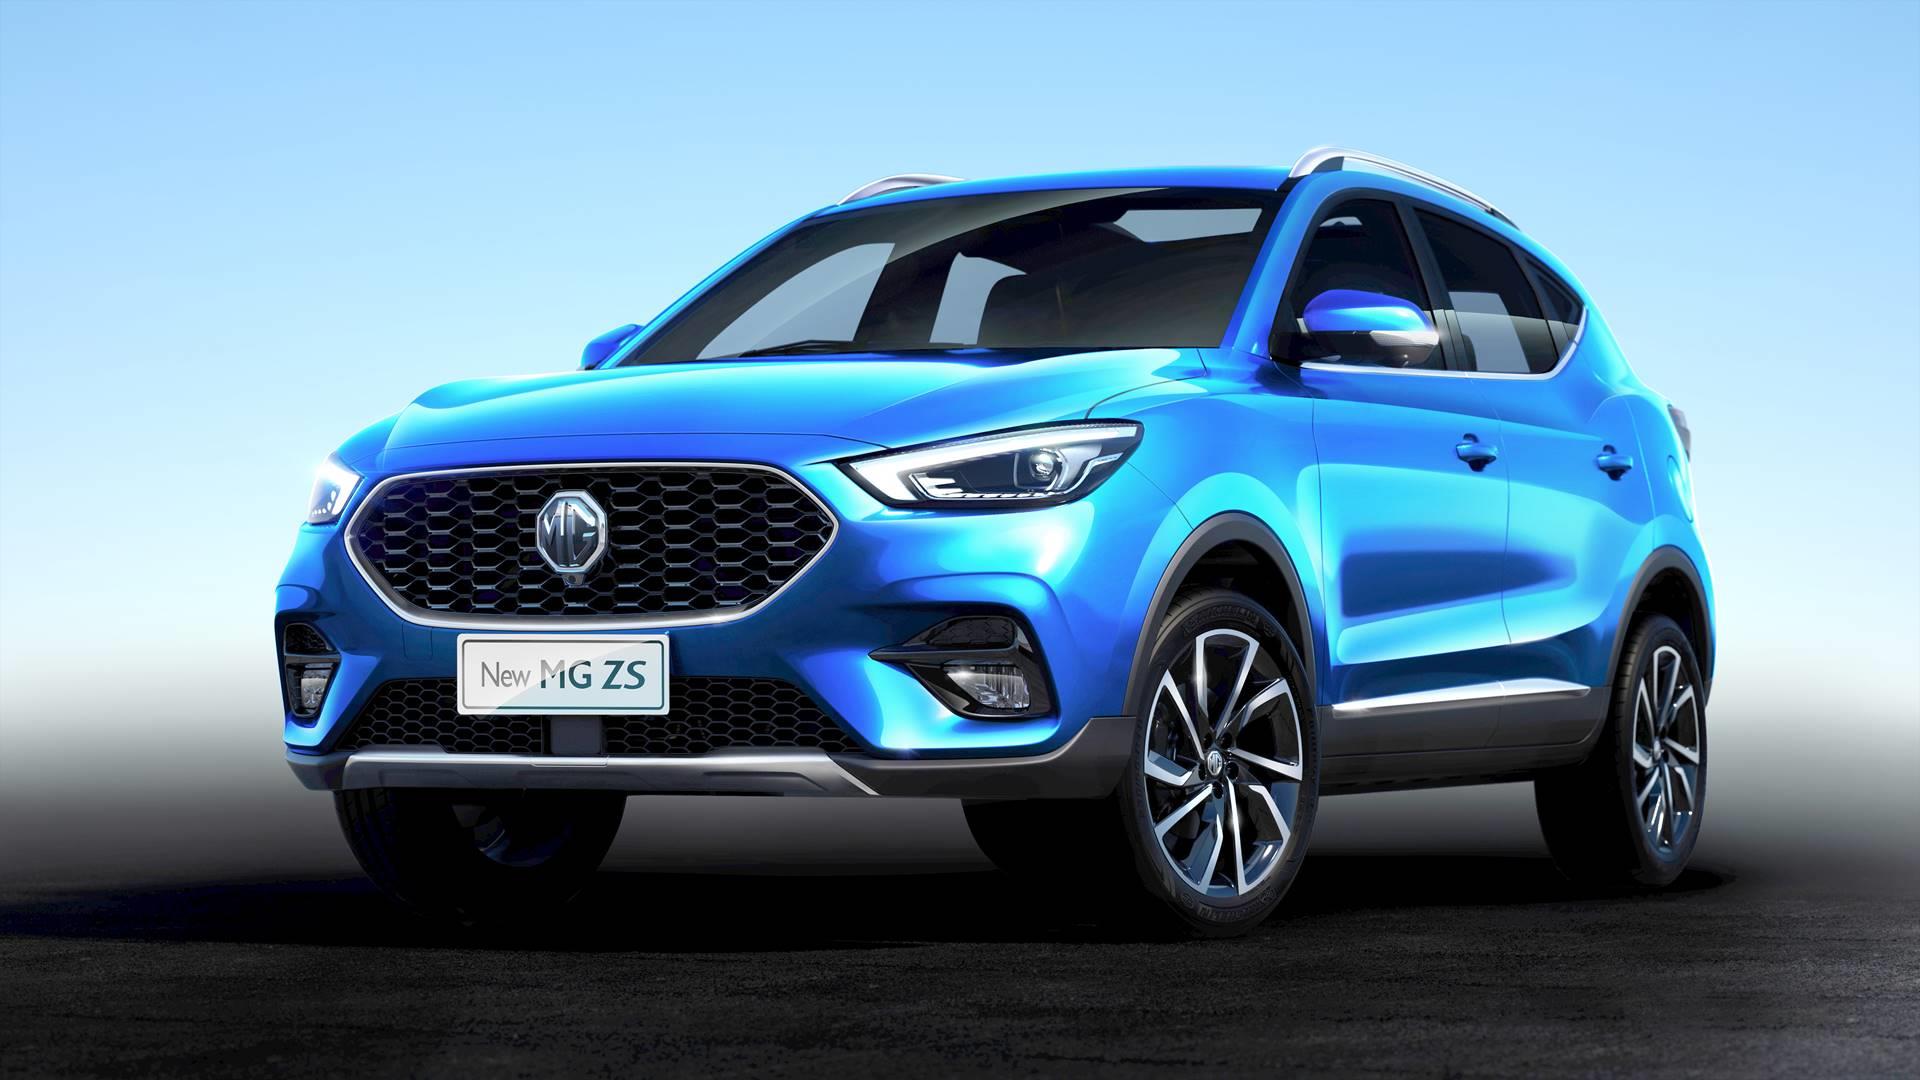
Annual sales figures for the MG ZS in Europe / UK.
See how MG ZS sales compare to the other models in the small suv segment. Also find MG ZS sales figures in China.
SAIC MGZS2017 |
SAIC MGZS2018 |
SAIC MGZS2019 |
SAIC MGZS2020 |
SAIC MGZS2021 |
SAIC MGZS2022 |
|
January | 275 | 368 | 1.199 | 1.192 | 1.431 | |
February | 98 | 255 | 671 | 804 | 1.298 | |
March | 572 | 1.188 | 2.242 | 2.747 | 5.385 | |
April | 552 | 622 | 173 | 1.390 | 2.975 | |
May | 447 | 801 | 437 | 2.724 | ||
June | 452 | 728 | 1.962 | 34 | 4.025 | |
July | 474 | 688 | 2.330 | 4.682 | 3.397 | |
August | 428 | 412 | 1.661 | 2.341 | 2.854 | |
September | 570 | 1.095 | 3.708 | 2.326 | 5.506 | |
October | 584 | 605 | 2.204 | 5.565 | ||
November | 127 | 547 | 897 | 1.543 | 3.101 | 6.448 |
December | 247 | 377 | 2.213 | 1.546 | 1.324 |
SAIC MGZS |
|
2020 | 19.676 |
2019 | 9.872 |
2018 | 5.376 |
2017 | 374 |
Use the dropdown at the top right of this page to find sales figures for any other car model sold in Europe since the early 2000’s.
Car sales statistics are from the following countries: Austria, Belgium, Cyprus, Czech Republic, Denmark, Estonia, Finland, France, Germany, Great Britain, Greece, Hungary, Iceland, Ireland, Italy, Latvia, Lithuania, Luxembourg, Netherlands, Norway, Poland, Portugal, Romania, Slovakia, Slovenia, Spain, Sweden, Switzerland. Sources: Manufacturers, ANDC, JATO Dynamics.
SAIC MGZS2017 |
SAIC MGZS2018 |
SAIC MGZS2019 |
SAIC MGZS2020 |
SAIC MGZS2021 |
SAIC MGZS2022 |
|
January | 275 | 368 | 1.199 | 1.192 | 1.431 | |
February | 98 | 255 | 671 | 804 | 1.298 | |
March | 572 | 1.188 | 2.242 | 2.747 | 5.385 | |
April | 552 | 622 | 173 | 1.390 | 2.975 | |
May | 447 | 801 | 437 | 2.724 | ||
June | 452 | 728 | 1.962 | 34 | 4.025 | |
July | 474 | 688 | 2.330 | 4.682 | 3.397 | |
August | 428 | 412 | 1.661 | 2.341 | 2.854 | |
September | 570 | 1.095 | 3.708 | 2.326 | 5.506 | |
October | 584 | 605 | 2.204 | 5.565 | ||
November | 127 | 547 | 897 | 1.543 | 3.101 | 6.448 |
December | 247 | 377 | 2.213 | 1.546 | 1.324 |
SAIC MGZS |
|
2020 | 19.676 |
2019 | 9.872 |
2018 | 5.376 |
2017 | 374 |