
Maserati Ghibli
Here you will find monthly and yearly Canadian, European and U.S. sales figures for the Maserati Ghibli. The Maserati Ghibli name has been used for several distinct models produced by the Italian luxury car manufacturer Maserati. It first appeared as a grand tourer in the late 1960s and was later revived for a modern executive sedan.
Maserati Ghibli Overview
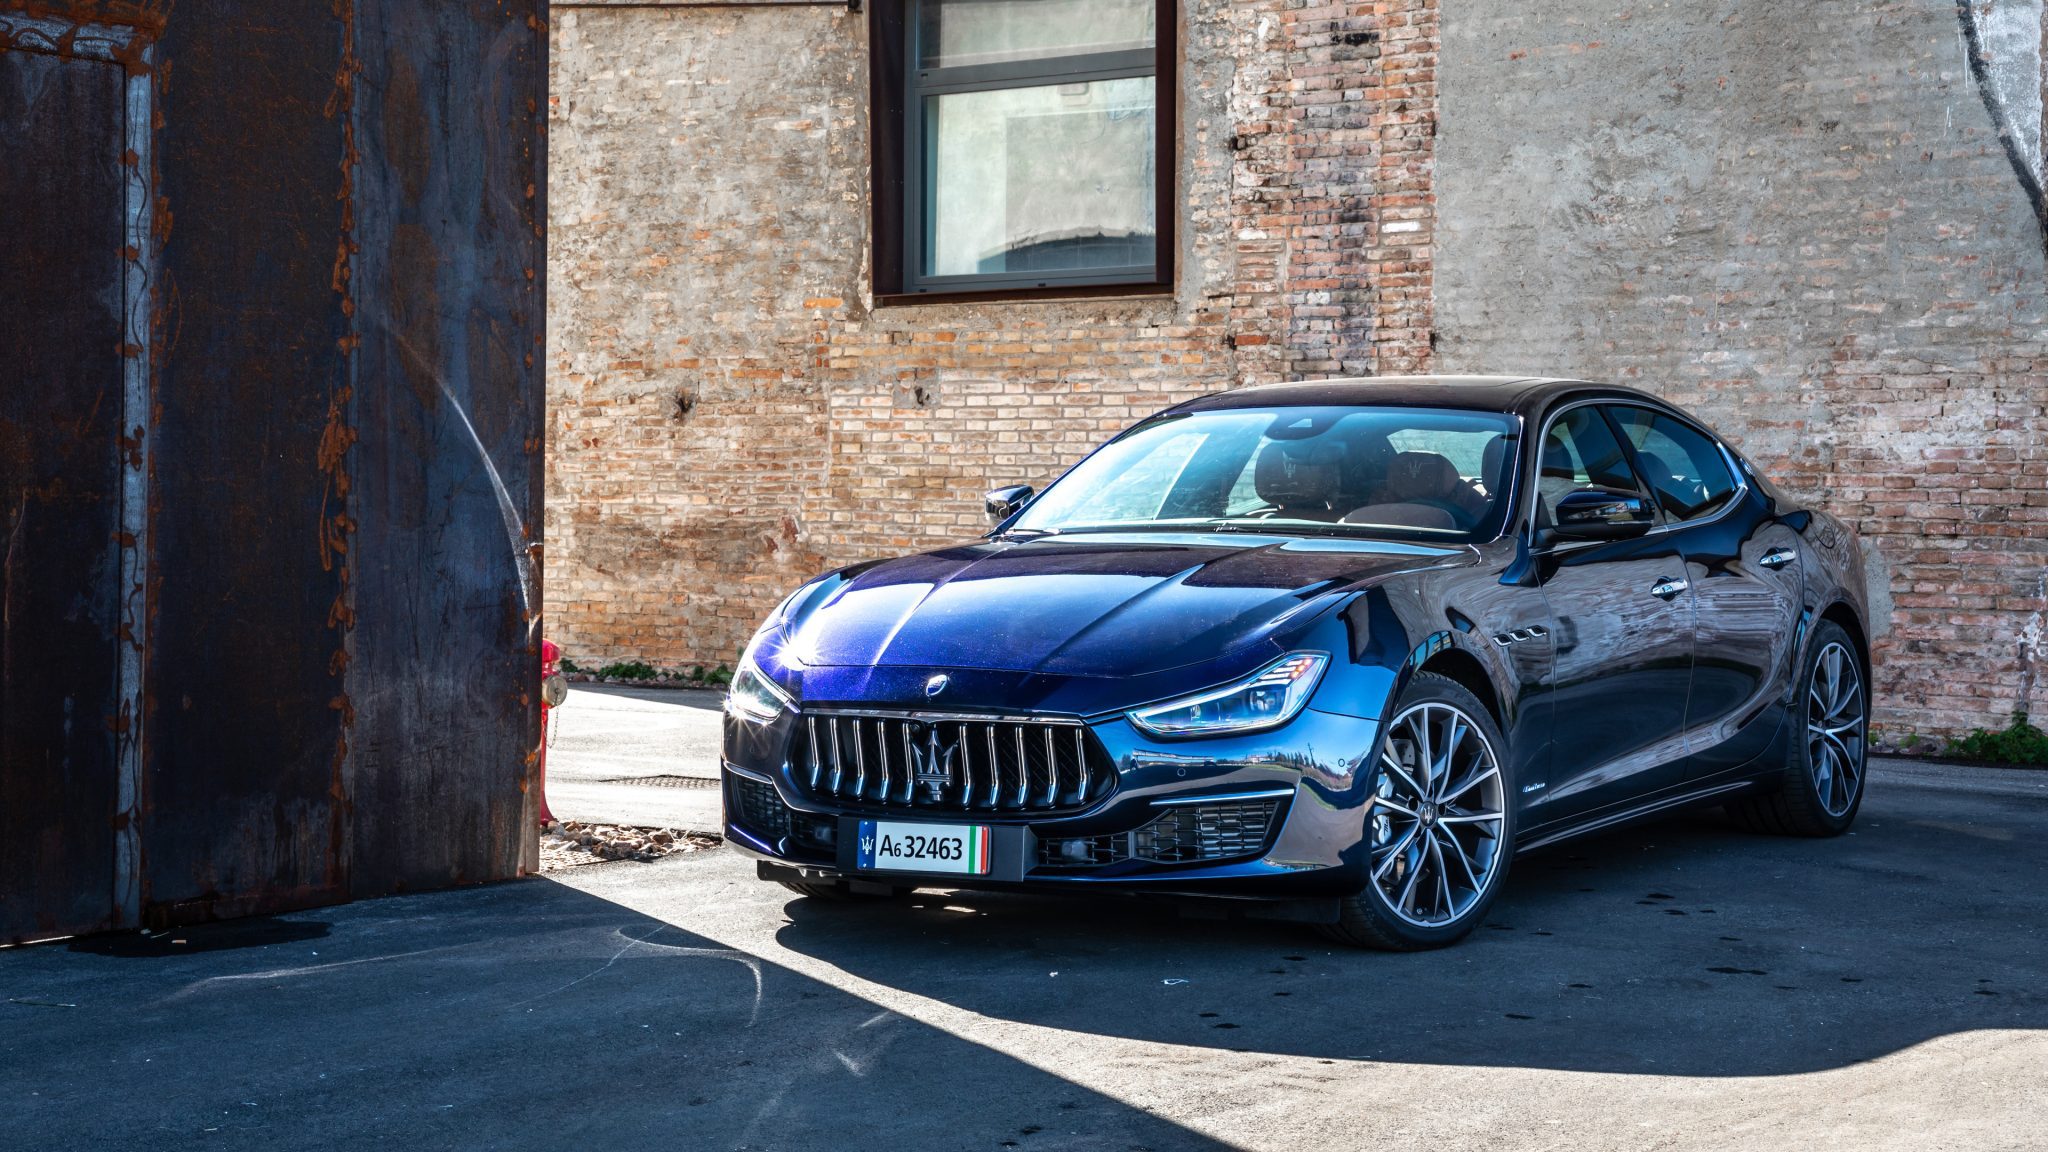
The Ghibli name was revived in 2013 for an executive sedan aimed at a broader market, competing with cars like the BMW 5 Series and Mercedes-Benz E-Class. The modern Ghibli carries Maserati’s signature design cues, with a prominent grille, aggressive lines, and a luxurious interior. Various engine options have been available, including turbocharged V6 and V8 petrol engines, as well as diesel options for some markets. The power output ranges from around 275 to over 580 horsepower in different versions. While offering robust performance, the modern Ghibli is tuned more for comfort and luxury compared to sportier Maserati models.
The modern Ghibli has received praise for its design, sound, and driving experience, but has faced some criticism for interior quality and technology compared to rivals. The modern Ghibli played a crucial role in Maserati’s plan to increase sales and reach a wider audience. The problem was that the Ghibli just didn’t sell in enough volumes to help Maserati catch up with the rest of the competition.
Maserati Ghibli Sales Figures
Maserati Ghibli U.S Sales Data & Charts
US Annual Sales
| Year | Sales Units |
|---|---|
| 2016 | 3,143 |
| 2017 | 5,635 |
| 2018 | 1,069 |
US Annual Growth
Maserati Ghibli Canada Sales Data & Charts
Canada Annual Sales
| Year | Sales Units |
|---|---|
| 2016 | 106 |
| 2017 | 324 |
| 2018 | 204 |
| 2019 | 151 |
| 2020 | 94 |
| 2021 | 110 |
Canada Annual Growth
Maserati Ghibli Europe Sales Data & Charts
Europe Annual Sales
| Year | Sales Units |
|---|---|
| 2000 | 9 |
| 2001 | 4 |
| 2013 | 339 |
| 2014 | 4,238 |
| 2015 | 4,644 |
| 2016 | 4,124 |
| 2017 | 2,981 |
| 2018 | 2,534 |
| 2019 | 1,723 |
| 2020 | 1,006 |
| 2021 | 1,434 |
| 2022 | 898 |


