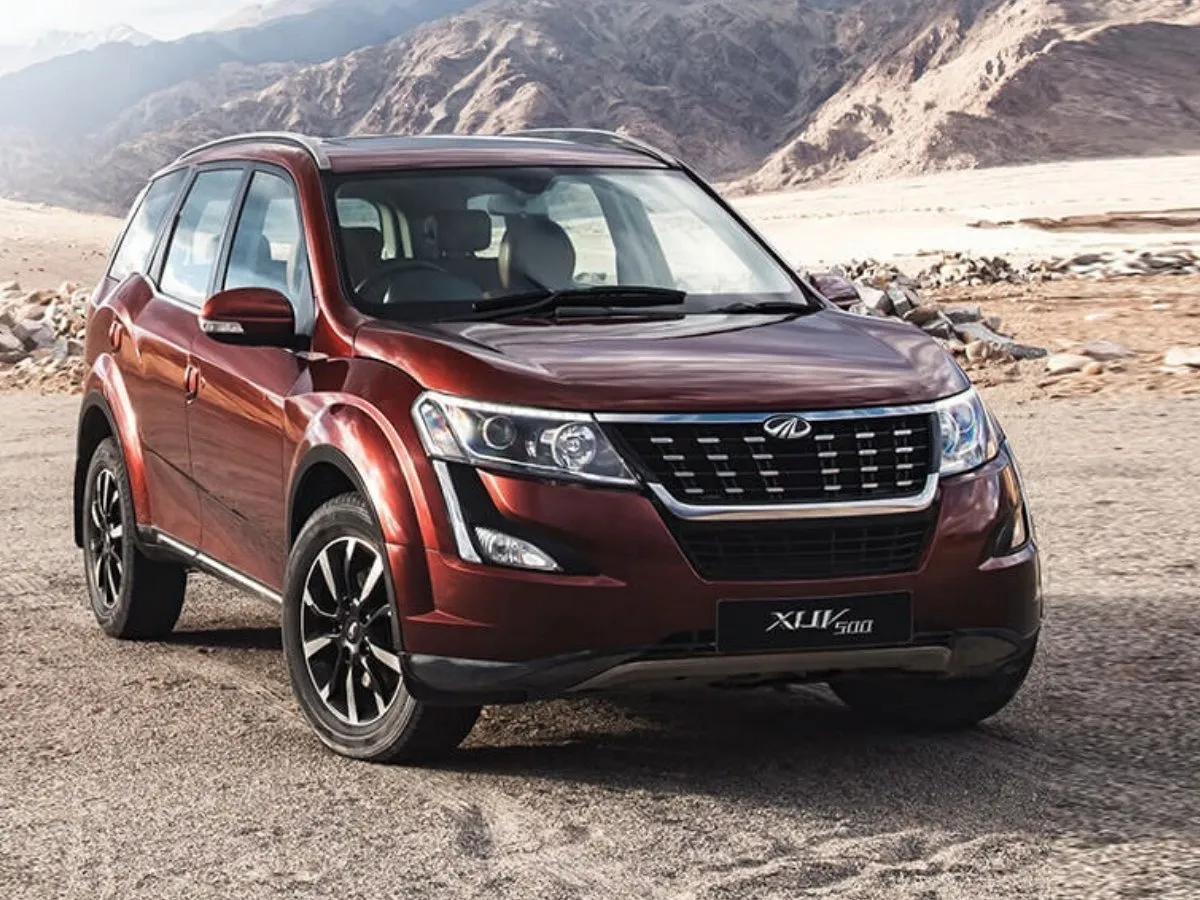
Mahindra_XUV500-auto-sales-statistics-EuropeAnnual sales figures for the Mahindra XUV500 in Europe.

See how Mahindra XUV500 sales compare to the other models in the midsized suv segment.


Mahindra
XUV500
2017
Mahindra
XUV500
2018
Mahindra
XUV500
2019
Mahindra
XUV500
2020
Mahindra
XUV500
2021
Mahindra
XUV500
2022
January 40 39 11 4 0 1
February 39 27 14 3 1
March 39 29 16 2 2
April 30 21 8 1 3
May 29 22 11 2 2
June 32 22 10 3 3
July 36 31 10 4 2
August 39 21 10 4 1
September 32 33 6 6 3
October 36 25 5 4 3
November 32 33 8 2 4
December 32 19 10 2 20

Mahindra
XUV500
2021 44
2020 307
2019 119
2018 322
2017 416
2016 387
2015 424
2014 257
2013 259
2012 65


Use the dropdown at the top right of this page to find sales figures for any other car model sold in Europe since the early 2000’s.

Car sales statistics are from the following countries: Austria, Belgium, Cyprus, Czech Republic, Denmark, Estonia, Finland, France, Germany, Great Britain, Greece, Hungary, Iceland, Ireland, Italy, Latvia, Lithuania, Luxembourg, Netherlands, Norway, Poland, Portugal, Romania, Slovakia, Slovenia, Spain, Sweden, Switzerland. Sources: Manufacturers, ANDC, JATO Dynamics.

Mahindra
XUV500
2017
Mahindra
XUV500
2018
Mahindra
XUV500
2019
Mahindra
XUV500
2020
Mahindra
XUV500
2021
Mahindra
XUV500
2022
January 40 39 11 4 0 1
February 39 27 14 3 1
March 39 29 16 2 2
April 30 21 8 1 3
May 29 22 11 2 2
June 32 22 10 3 3
July 36 31 10 4 2
August 39 21 10 4 1
September 32 33 6 6 3
October 36 25 5 4 3
November 32 33 8 2 4
December 32 19 10 2 20

Mahindra
XUV500
2021 44
2020 307
2019 119
2018 322
2017 416
2016 387
2015 424
2014 257
2013 259
2012 65