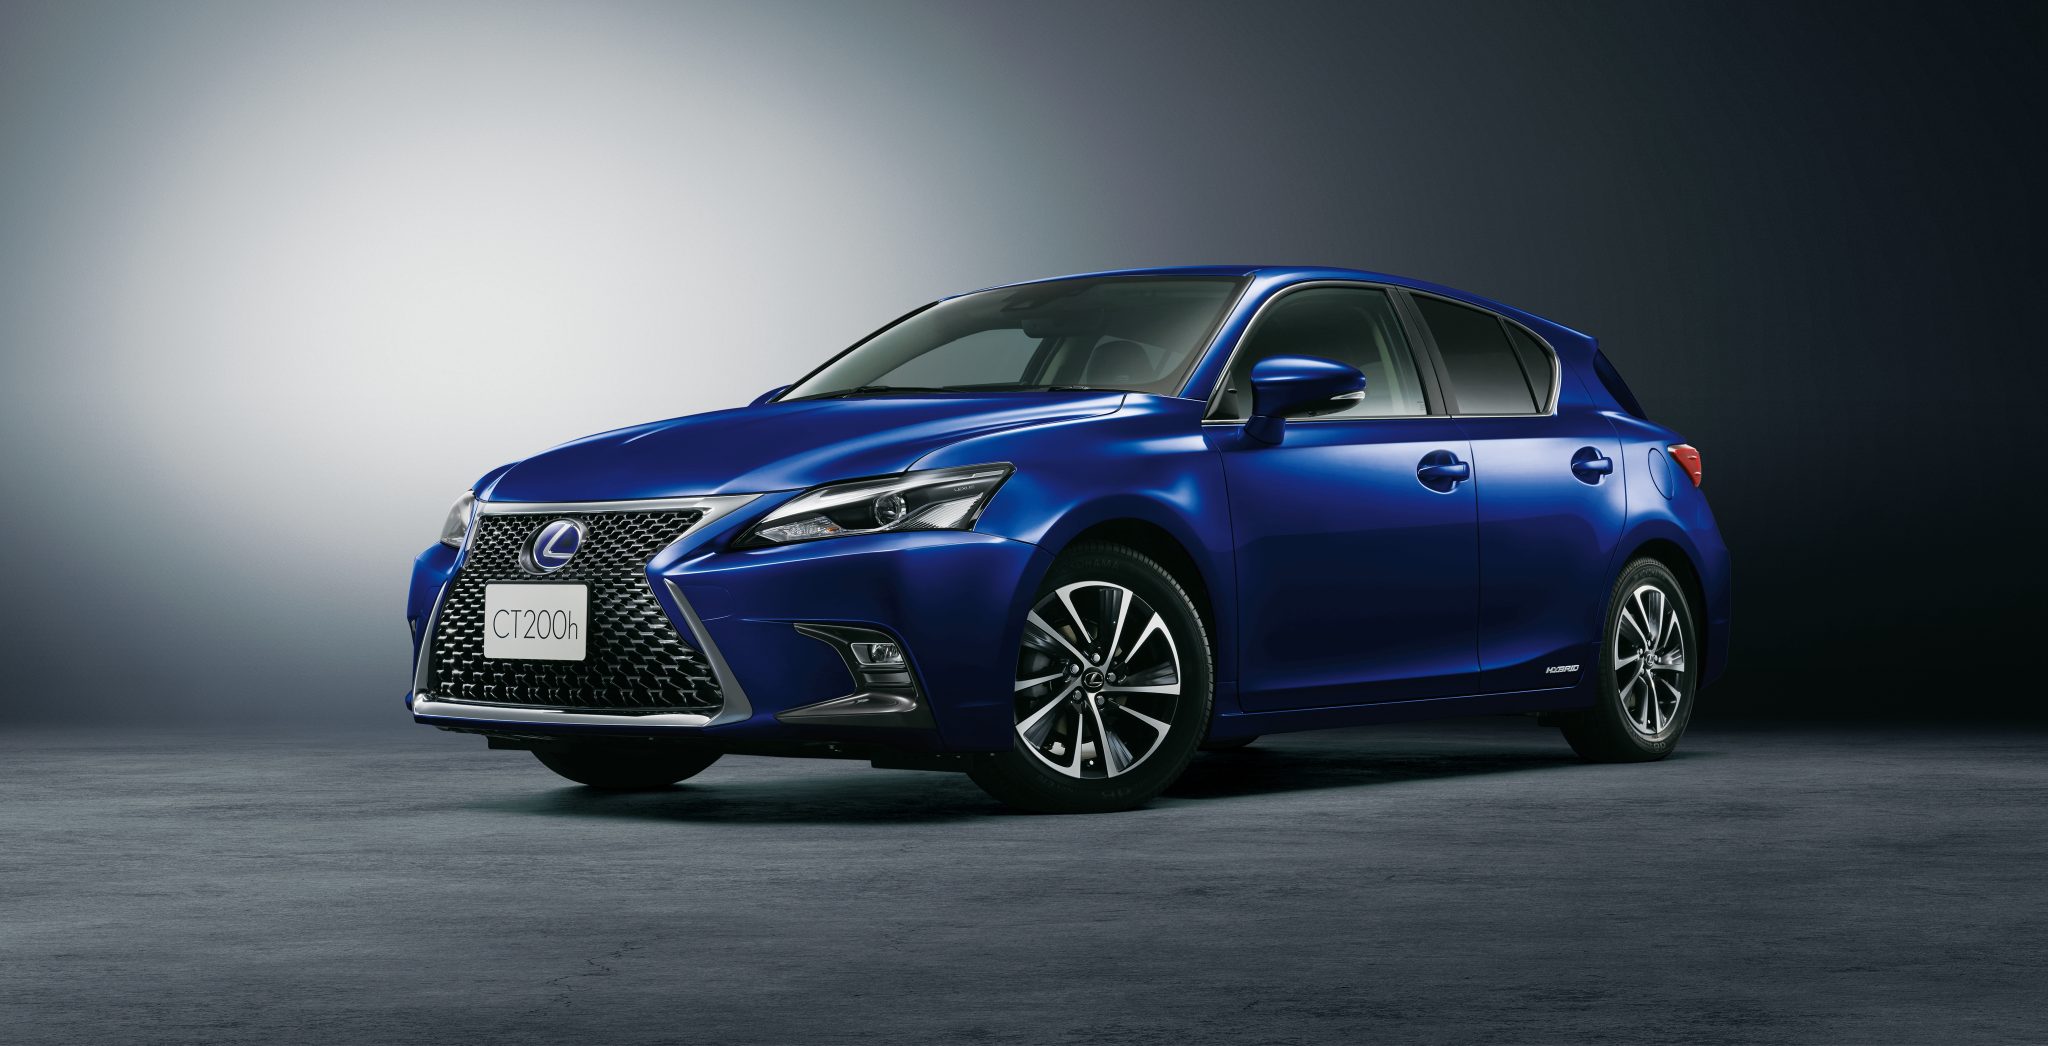
Here you will find monthly and yearly Canadian, European and U.S. sales figures for the Lexus CT. The Lexus CT is a luxury hatchback that was produced by Lexus from 2011 to 2020. It was the first Lexus model to be offered with a hybrid powertrain. The CT was powered by a 1.8L four-cylinder engine and an electric motor that produced a combined output of 134 horsepower. It was mated to a continuously variable transmission (CVT). The CT got an EPA-estimated 43 mpg in the city and 40 mpg on the highway.
The CT had a spacious interior for its size and could seat up to five passengers. It had a cargo capacity of 17.1 cubic feet with the rear seats up and 34.8 cubic feet with the rear seats folded down. The CT came standard with a variety of features, including a six-speaker sound system, a rearview camera, and Bluetooth. Available features included a sunroof, a navigation system, and a Mark Levinson sound system. The Lexus CT was discontinued in 2020 and was not replaced by a direct successor. However, Lexus does offer the UX, which is a smaller luxury SUV that is available with a hybrid powertrain.


I went from $160-$200 in gas per week to $39-$44. I LOVE OUR new CT200h… best purchase EVERRRRRRRRRRRRr