
Land Rover LR2
Here you will find monthly and yearly sales figures for the Land Rover LR2. LR2 sales figures include sales of its predecessor, the Freelander. Rather troublingly, Land Rover’s figures don’t always add up. It’s possible Land Rover only sold 188 LR2s in the U.S. in October 2011 as the year-to-date figure does not match the totalled monthly figures. Simple math clarifies the fact that, unfortunately, the monthly Canadian data from 2012 does not add up to the year end total.
The Land Rover LR2/Freelander 2 was a crucial vehicle for Land Rover during its production period, providing an accessible entry point into the brand’s lineup. While it had its set of challenges, the model showcased Land Rover’s commitment to blending luxury, technology, and off-road capability in a compact SUV format. The lessons learned from the LR2 played a role in shaping the successors that followed, enhancing the brand’s offerings in the competitive luxury SUV market.
Land Rover LR2 Overview
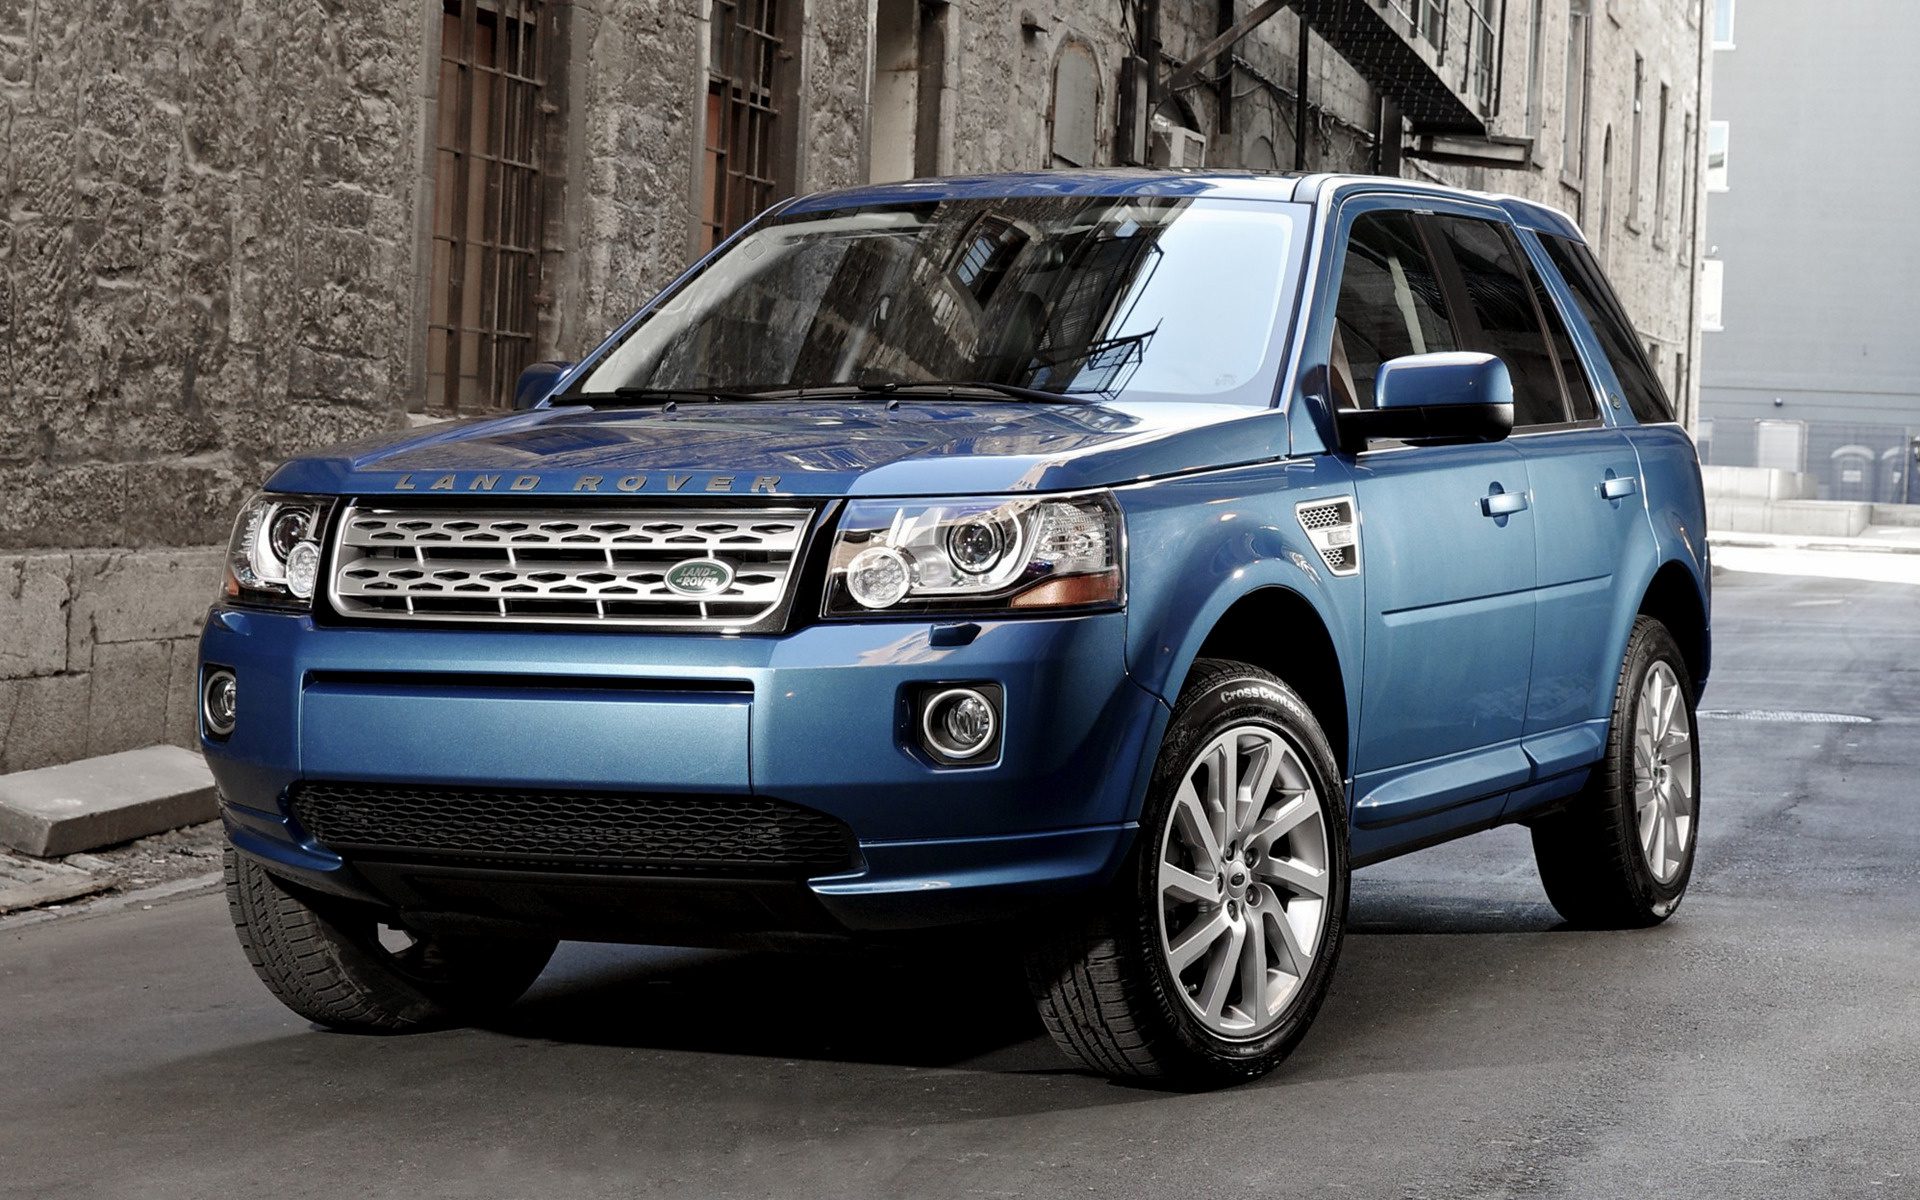
The Land Rover LR2, also known as the Freelander 2 in markets outside North America, is a compact luxury SUV produced by British manufacturer Land Rover. Introduced in 2006, it represented the second generation of the Freelander lineup, replacing the original Freelander that had been in production since 1997.
Before the LR2, the original Freelander was Land Rover’s attempt to tap into the growing market for compact SUVs. While it brought many new buyers to the brand, the first-gen Freelander faced criticism for its reliability issues. Addressing the concerns from the first generation, the LR2 was a substantial improvement in terms of build quality, refinement, and capability. It was larger and more luxurious than its predecessor, aiming to offer a taste of the premium Land Rover experience in a more compact package.
In keeping with the Land Rover heritage, the LR2 was equipped with advanced off-road technology such as the Terrain Response system, which adjusted various vehicle settings to optimize performance on different surfaces like mud, sand, or snow. he LR2 occupied the entry-level position in Land Rover’s lineup for much of its life, positioned below the larger Discovery and Range Rover models. Its compact size was aimed at those who needed urban practicality combined with weekend adventure capability.
The LR2 was generally seen as a significant step up from the original Freelander in terms of quality, capability, and luxury. While the LR2 was an improvement over its predecessor, some owners reported reliability concerns, particularly with electronics and powertrain components. However, it should be noted that this was a broader issue with luxury brands and not exclusive to Land Rover.
The LR2 was succeeded by the Land Rover Discovery Sport in 2014, which took over the role of Land Rover’s entry-level SUV. The Discovery Sport carried forward the compact luxury SUV proposition but with a more modern design, updated technologies, and flexible seating configurations.
Land Rover LR2 Sales Figures
Land Rover LR2 U.S Sales Data & Charts
US Annual Sales
| Year | Sales Units |
|---|---|
| 2007 | 9,205 |
| 2008 | 4,316 |
| 2009 | 3,850 |
| 2010 | 3,649 |
| 2011 | 2,831 |
| 2012 | 3,327 |
| 2013 | 3,315 |
| 2014 | 3,619 |
| 2015 | 77 |
| 2016 | 3 |
US Annual Growth
Land Rover LR2 Canada Sales Data & Charts
Canada Annual Sales
| Year | Sales Units |
|---|---|
| 2012 | 335 |
| 2013 | 520 |
| 2014 | 655 |
| 2015 | 80 |
Canada Annual Growth
Land Rover LR2 Europe Sales Data & Charts
Europe Annual Sales
| Year | Sales Units |
|---|---|
| 1997 | 529 |
| 1998 | 36,970 |
| 1999 | 57,216 |
| 2000 | 58,549 |
| 2001 | 53,366 |
| 2002 | 48,535 |
| 2003 | 42,475 |
| 2004 | 46,055 |
| 2005 | 36,819 |
| 2006 | 25,642 |
| 2007 | 40,836 |
| 2008 | 28,461 |
| 2009 | 23,765 |
| 2010 | 29,350 |
| 2011 | 24,123 |
| 2012 | 18,407 |
| 2013 | 21,224 |
| 2014 | 16,983 |
| 2015 | 346 |
| 2016 | 29 |
| 2017 | 2 |
| 2018 | 3 |
Europe Annual Growth


