
Land Rover Defender
Here you will find monthly and yearly U.S, Canadian and European sales figures for the Land Rover Defender. The Land Rover Defender is a legendary off-road vehicle, recognized globally for its rugged capability and iconic design. Originating from the original Land Rover Series vehicles, the Defender has a storied history that spans several decades, embodying the spirit of adventure and exploration. The origins of the Defender can be traced back to the post-WWII Land Rover Series vehicles. Designed for agricultural use, the Series I, Series II, and Series III models established a reputation for durability, versatility, and off-road capability.
Land Rover Defender Overview
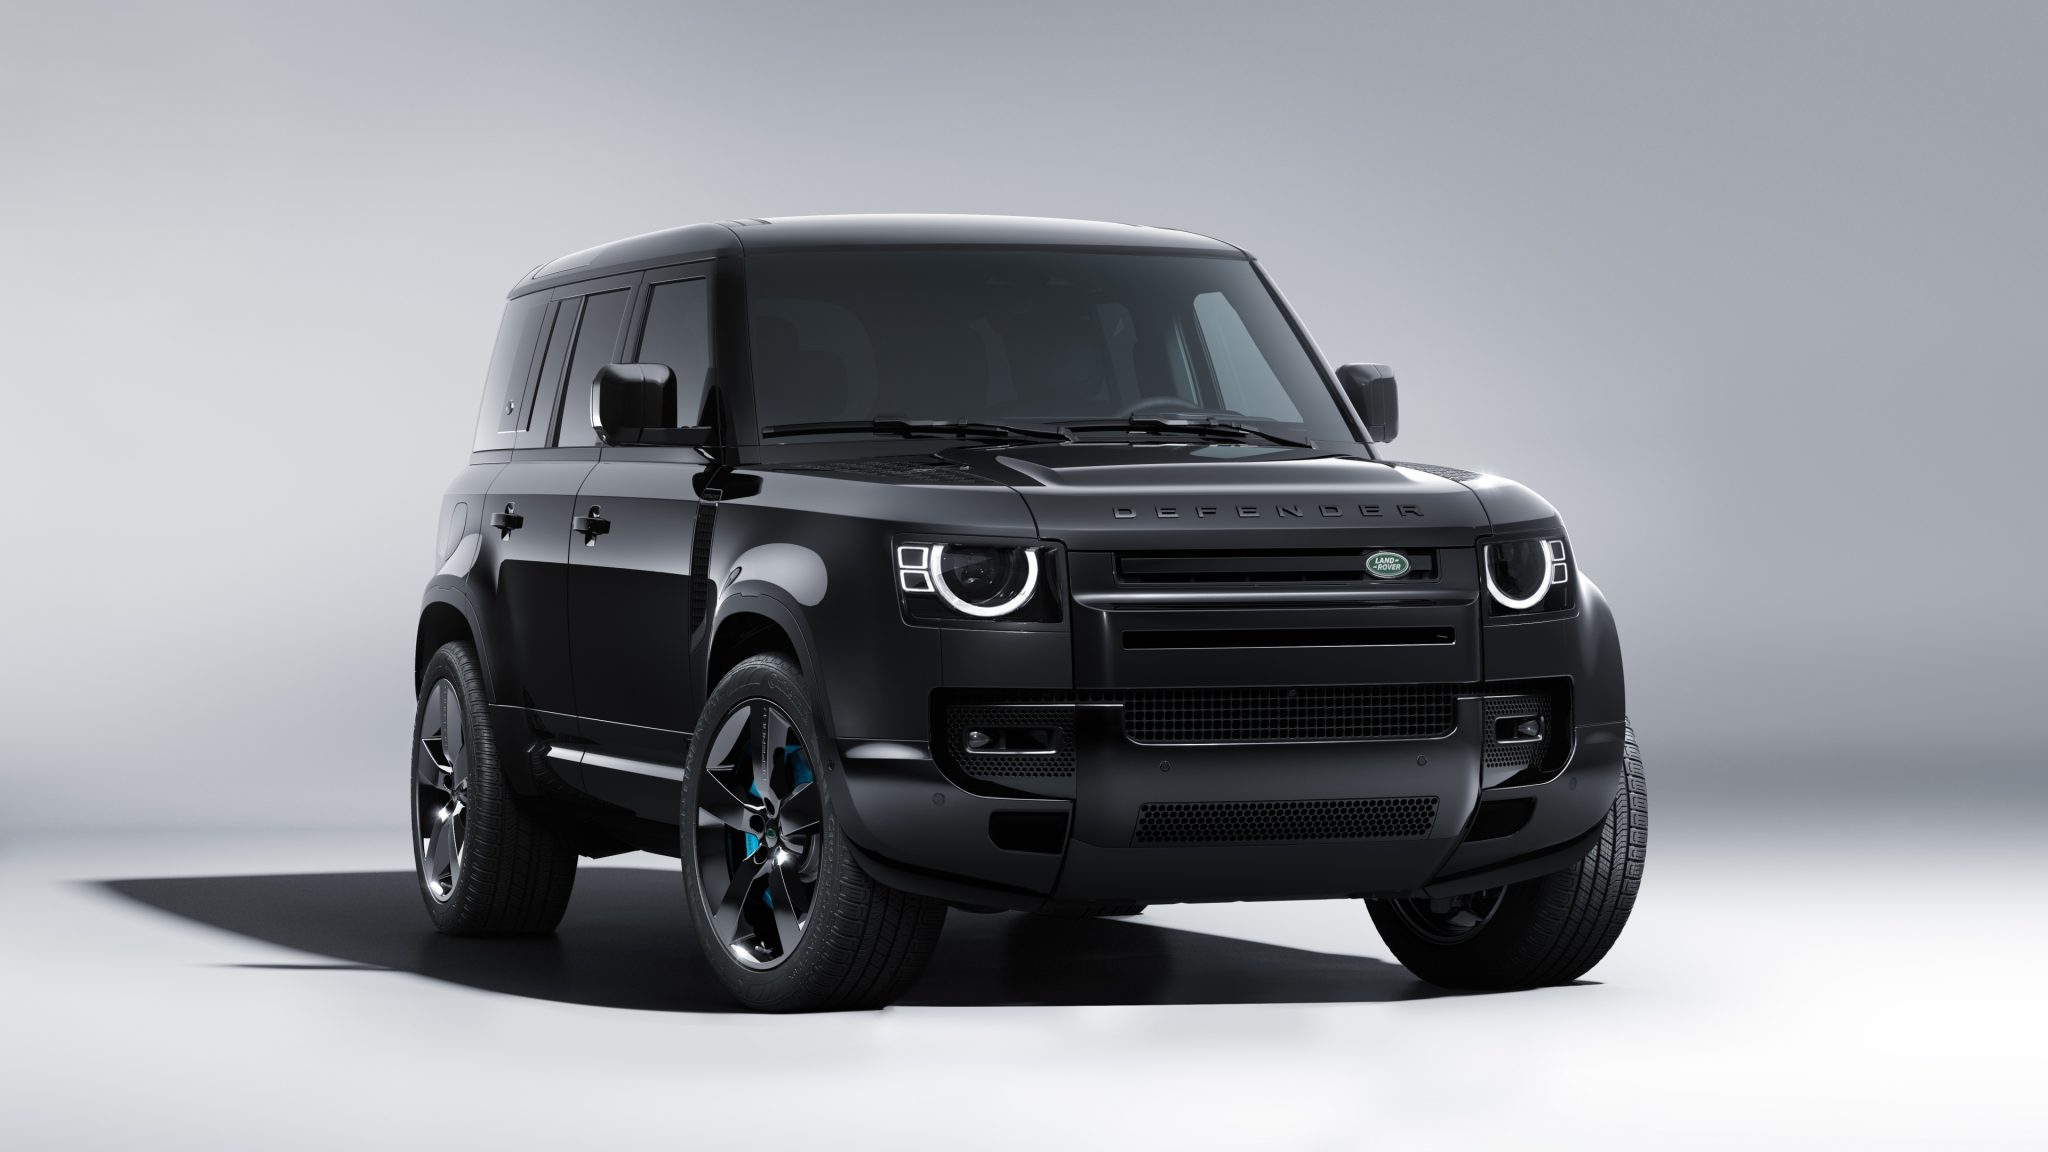
The Defender has always been recognized by its boxy, utilitarian design. Even with modern updates, it retains this iconic silhouette. The Defender is engineered for challenging terrains. Features like a robust 4×4 system, high ground clearance, and advanced terrain response systems ensure it can tackle a wide range of off-road conditions. The Defender’s design emphasizes practicality, from its spacious interior to features like a side-hinged rear tailgate and a flat roof.
The Defender, and its Series predecessors, have been used around the world for various purposes – from military applications to safari expeditions to humanitarian missions. The Defender has achieved cult status among off-road enthusiasts and has a dedicated global fanbase. Many appreciate its simplicity, reliability, and rugged charm. The latest generation of the Defender has generally been well-received for successfully blending modern technology and comforts with the legacy of the Defender name. However, some purists have voiced concerns about the vehicle moving away from its utilitarian roots.
It is currently in its third generation, which was introduced in 2020. The Defender is known for its off-road capability, rugged design, and go-anywhere attitude. The current-generation Defender is available with a choice of three engines: a 2.0-liter turbocharged four-cylinder engine, a 3.0-liter turbocharged inline-six engine, and a 3.0-liter turbocharged inline-six engine with mild-hybrid assistance. All three engines are mated to an eight-speed automatic transmission. The Defender is available in a variety of trim levels, including the base Defender, the mid-level XS, and the top-of-the-line X. The Defender is a popular car in the United States. It has won numerous awards, including the 2020 World Car of the Year award.
Land Rover Defender Sales Figures
Land Rover Defender U.S Sales Data & Charts
US Monthly Sales
US Annual Sales
| Year | Sales Units |
|---|---|
| 2020 | 9,100 |
| 2021 | 19,080 |
| 2022 | 15,733 |
| 2023 | 21,212 |
| 2024 | 5,706 |
US Annual Growth
Land Rover Defender Canada Sales Data & Charts
Canada Annual Sales
| Year | Sales Units |
|---|---|
| 2020 | 829 |
| 2021 | 1,775 |
Canada Annual Growth
Land Rover Defender Europe Sales Data & Charts
Europe Annual Sales
| Year | Sales Units |
|---|---|
| 1997 | 4,850 |
| 1998 | 5,428 |
| 1999 | 6,596 |
| 2000 | 7,350 |
| 2001 | 5,326 |
| 2002 | 7,446 |
| 2003 | 8,276 |
| 2004 | 9,006 |
| 2005 | 8,584 |
| 2006 | 8,663 |
| 2007 | 8,137 |
| 2008 | 8,089 |
| 2009 | 5,604 |
| 2010 | 4,117 |
| 2011 | 1,443 |
| 2012 | 971 |
| 2013 | 810 |
| 2014 | 1,147 |
| 2015 | 1,237 |
| 2016 | 182 |
| 2017 | 7 |
| 2018 | 1 |
| 2019 | 1 |
| 2020 | 8,729 |
| 2021 | 14,936 |
| 2022 | 17,612 |
Europe Annual Growth
Land Rover Defender Generations
Land Rover 90 and 110 (1983-1990)
These models, named after their respective wheelbase lengths in inches, were a continuation of the Series lineup but with significant updates in design and engineering.
Land Rover Defender (1990-2016)
In 1990, the 90 and 110 models were renamed the Defender 90 and Defender 110 to emphasize their rugged capabilities and to distinguish them from the more luxury-oriented Land Rover Discovery. The Defender remained largely unchanged in its essence throughout this period, emphasizing utility and off-road prowess. Production of this generation ended in 2016, owing to stringent emission and safety regulations.
Land Rover Defender (2020-Present)
After a brief hiatus, the Defender was reintroduced as an all-new model in 2020. While it maintains design cues from the classic Defender, it’s thoroughly modern in terms of technology, comfort, and safety. It offers a wide range of engine options, including petrol, diesel, and hybrid variants. This generation also boasts impressive off-road technology, making it both a luxury SUV and a capable off-roader.


