Monthly and annual sales figures for the Lancia Delta in Europe.
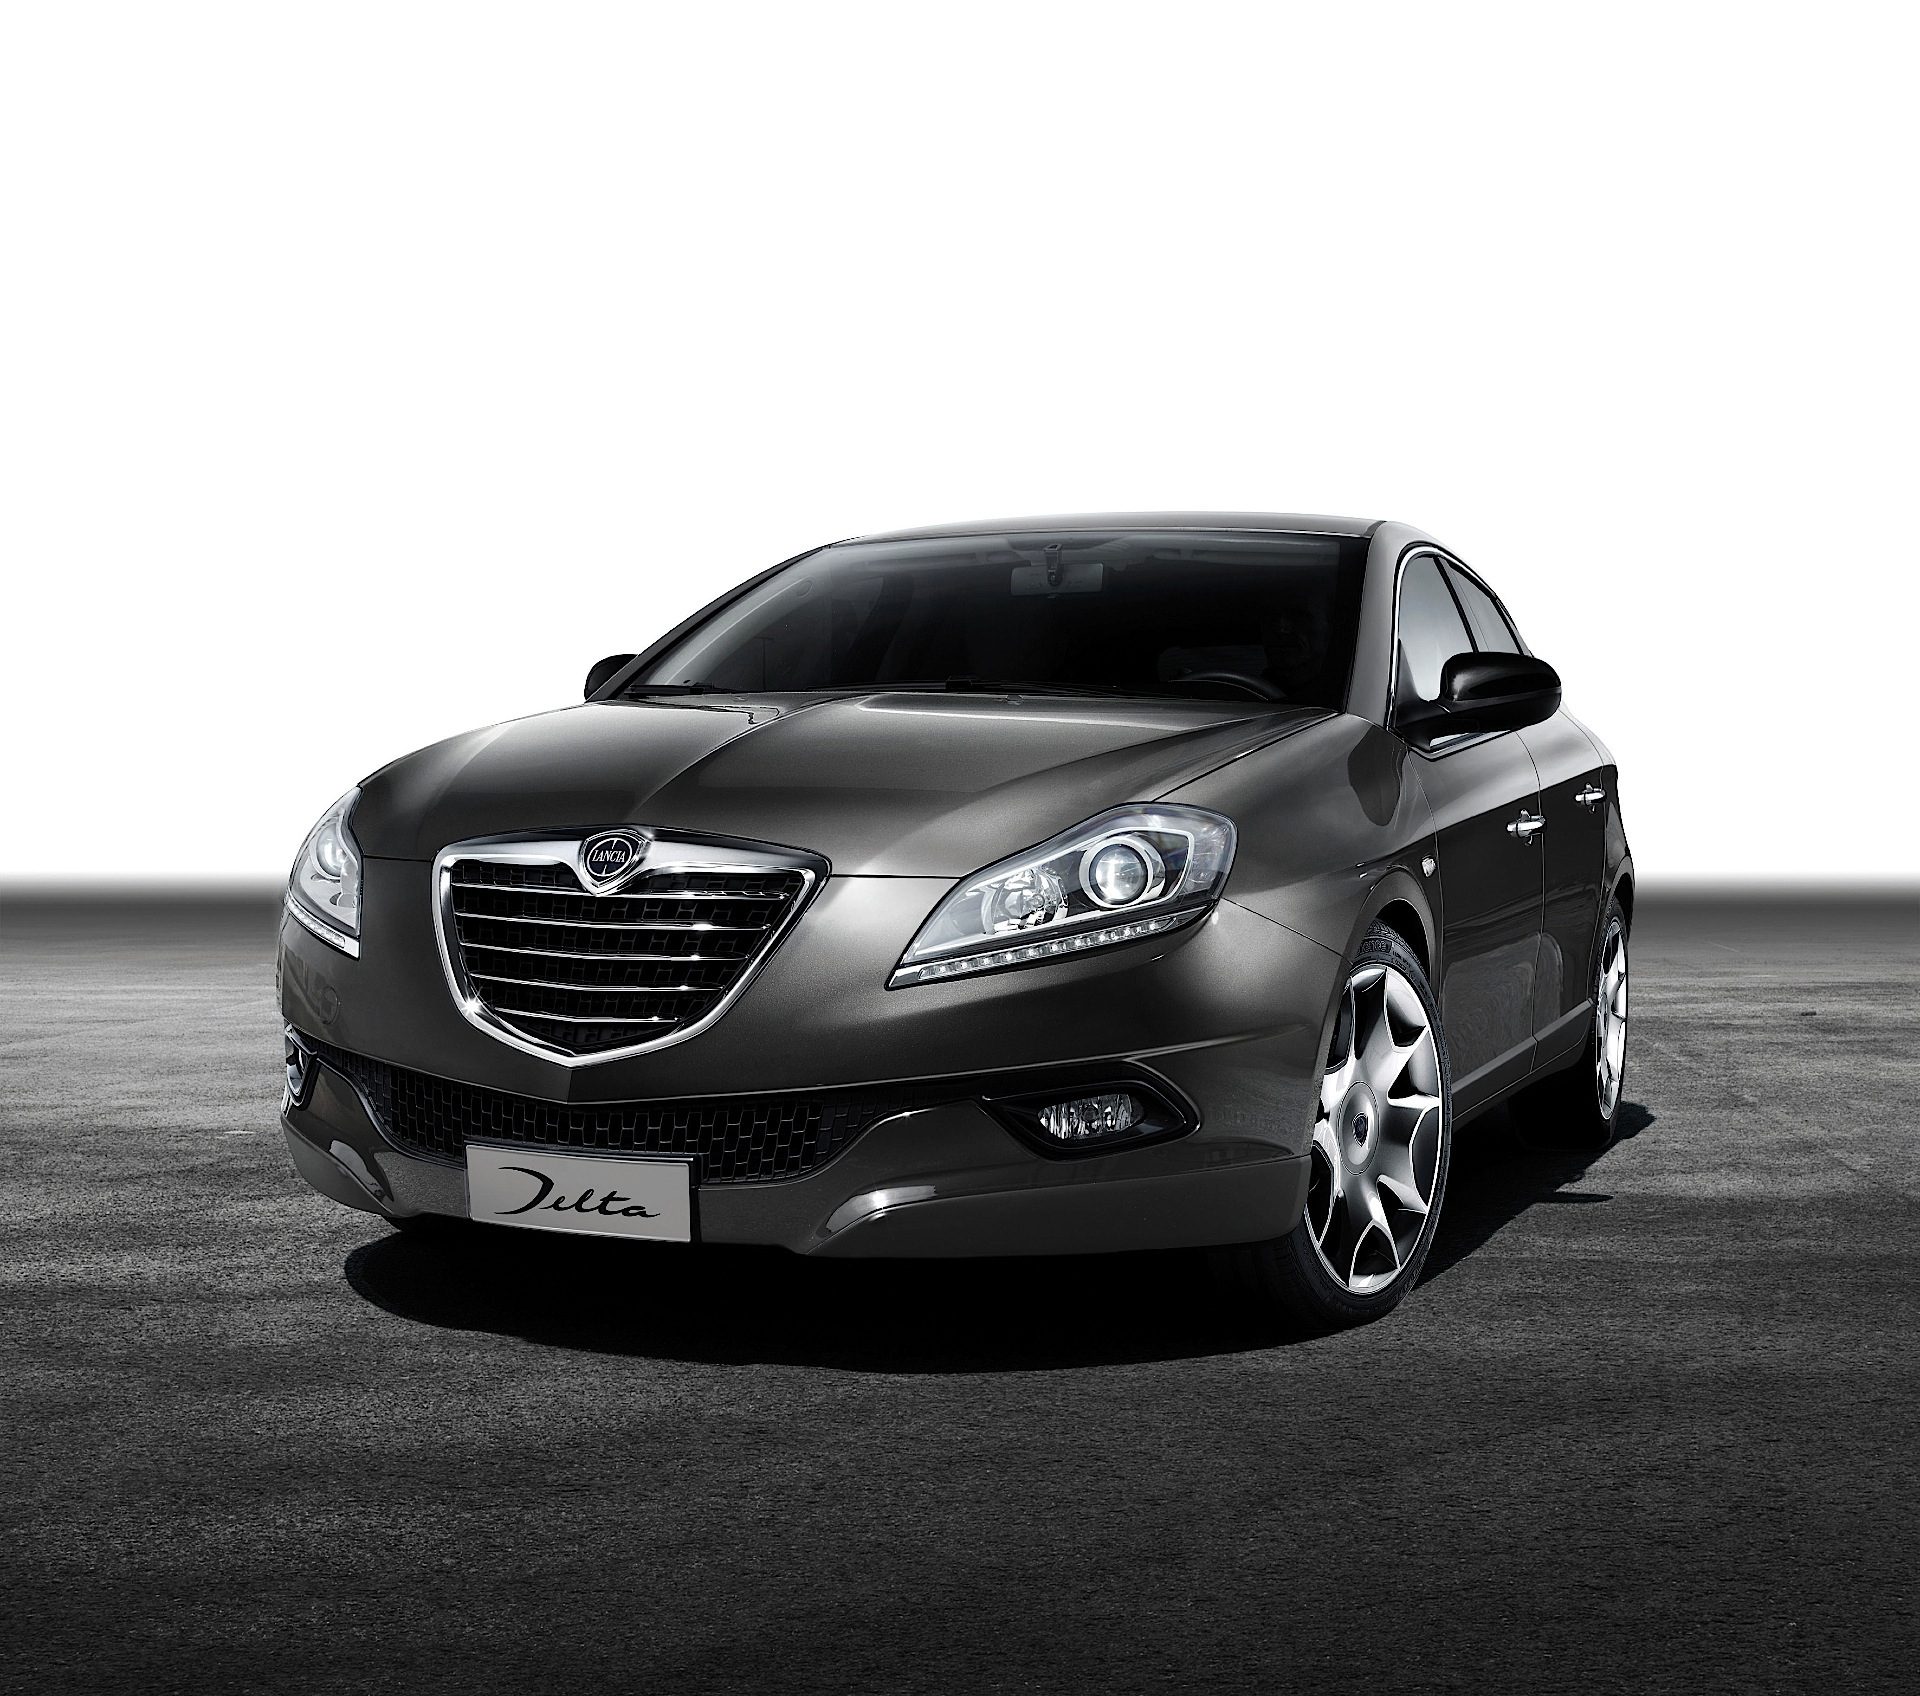
Note: these statistics include sales of the Lancia Delta separately. Click on the brand to find sales numbers of the Lancia-Chrysler Delta combined and of the Chrysler Delta separately.
LanciaDelta2016 |
LanciaDelta2017 |
LanciaDelta2018 |
|
January | 1 | ||
February | 1 | 1 | |
March | 1 | ||
April | |||
May | 1 | ||
June | |||
July | 1 | ||
August | 8 | ||
September | |||
October | 1 | ||
November | |||
December | 1 |
LanciaDelta |
|
2018 | 2 |
2017 | 3 |
2016 | 11 |
2015 | 282 |
2014 | 4.203 |
2013 | 8.739 |
2012 | 13.296 |
2011 | 18.673 |
2010 | 23.426 |
2009 | 29.971 |
2008 | 13.934 |
2007 | 3 |
See how Lancia Delta sales compare to the other models in the premium compact car segment.
Use the dropdown at the top right of this page to find sales figures for any other car model sold in Europe since the early 2000’s. Car sales statistics are from the following countries: Austria, Belgium, Cyprus, Czech Republic, Denmark, Estonia, Finland, France, Germany, Great Britain, Greece, Hungary, Iceland, Ireland, Italy, Latvia, Lithuania, Luxembourg, Netherlands, Norway, Poland, Portugal, Romania, Slovakia, Slovenia, Spain, Sweden, Switzerland. Sources: Manufacturers, ANDC, JATO Dynamics.
LanciaDelta2016 |
LanciaDelta2017 |
LanciaDelta2018 |
|
January | 1 | ||
February | 1 | 1 | |
March | 1 | ||
April | |||
May | 1 | ||
June | |||
July | 1 | ||
August | 8 | ||
September | |||
October | 1 | ||
November | |||
December | 1 |
LanciaDelta |
|
2018 | 2 |
2017 | 3 |
2016 | 11 |
2015 | 282 |
2014 | 4.203 |
2013 | 8.739 |
2012 | 13.296 |
2011 | 18.673 |
2010 | 23.426 |
2009 | 29.971 |
2008 | 13.934 |
2007 | 3 |