Ford Tourneo Custom
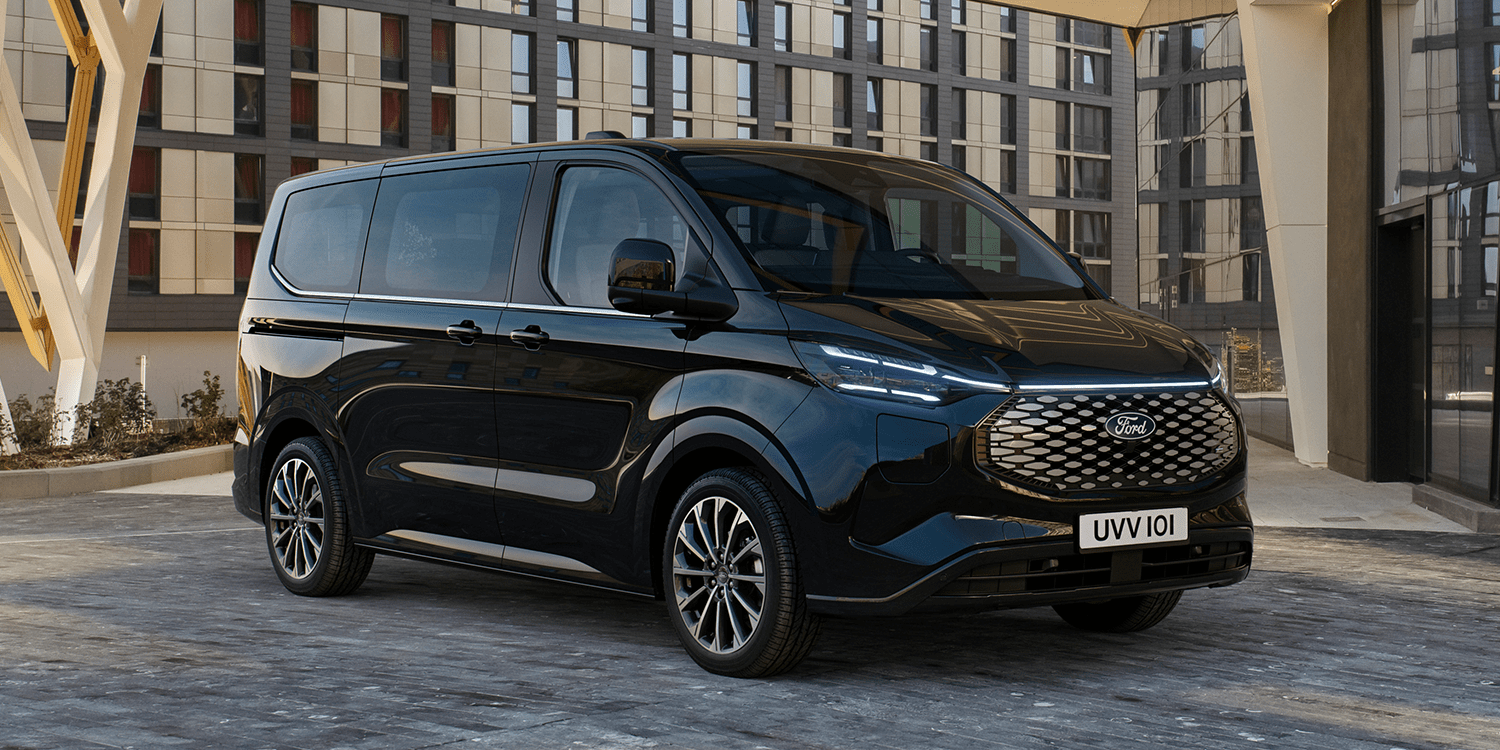
These sales statistics only include the Ford Tourneo Custom. Sales of the large Ford Transit Tourneo and the smaller Ford Tourneo Connect are published separately. The Ford Tourneo Custom is a van that is currently in its third generation. It is sold in Europe, Asia, and Africa. The Tourneo Custom is known for its spacious interior, comfortable ride, and variety of features.
The current-generation Tourneo Custom is available with a choice of two engines: a 2.0-liter turbocharged diesel engine and a 2.2-liter turbocharged diesel engine. Both engines are mated to a six-speed automatic transmission. The Tourneo Custom is available in a variety of body styles, including a passenger van, a cargo van, and a chassis cab. It is also available in a variety of trim levels, including the base Trend, the mid-level Titanium, and the top-of-the-line Active. The Tourneo Custom is a good choice for buyers who are looking for a van with a spacious interior. It is also a good choice for buyers who are looking for a van that is comfortable to ride in.
Ford Tourneo Custom Europe Sales Data & Charts
Europe Annual Sales
| Year | Sales Units |
|---|---|
| 2012 | 154 |
| 2013 | 4,800 |
| 2014 | 7,100 |
| 2015 | 9,700 |
| 2016 | 6,600 |
| 2017 | 13,500 |
| 2018 | 17,200 |
| 2019 | 23,067 |
| 2020 | 20,555 |
| 2021 | 26,033 |
| 2022 | 25,685 |
Europe Annual Growth