Ford Ka
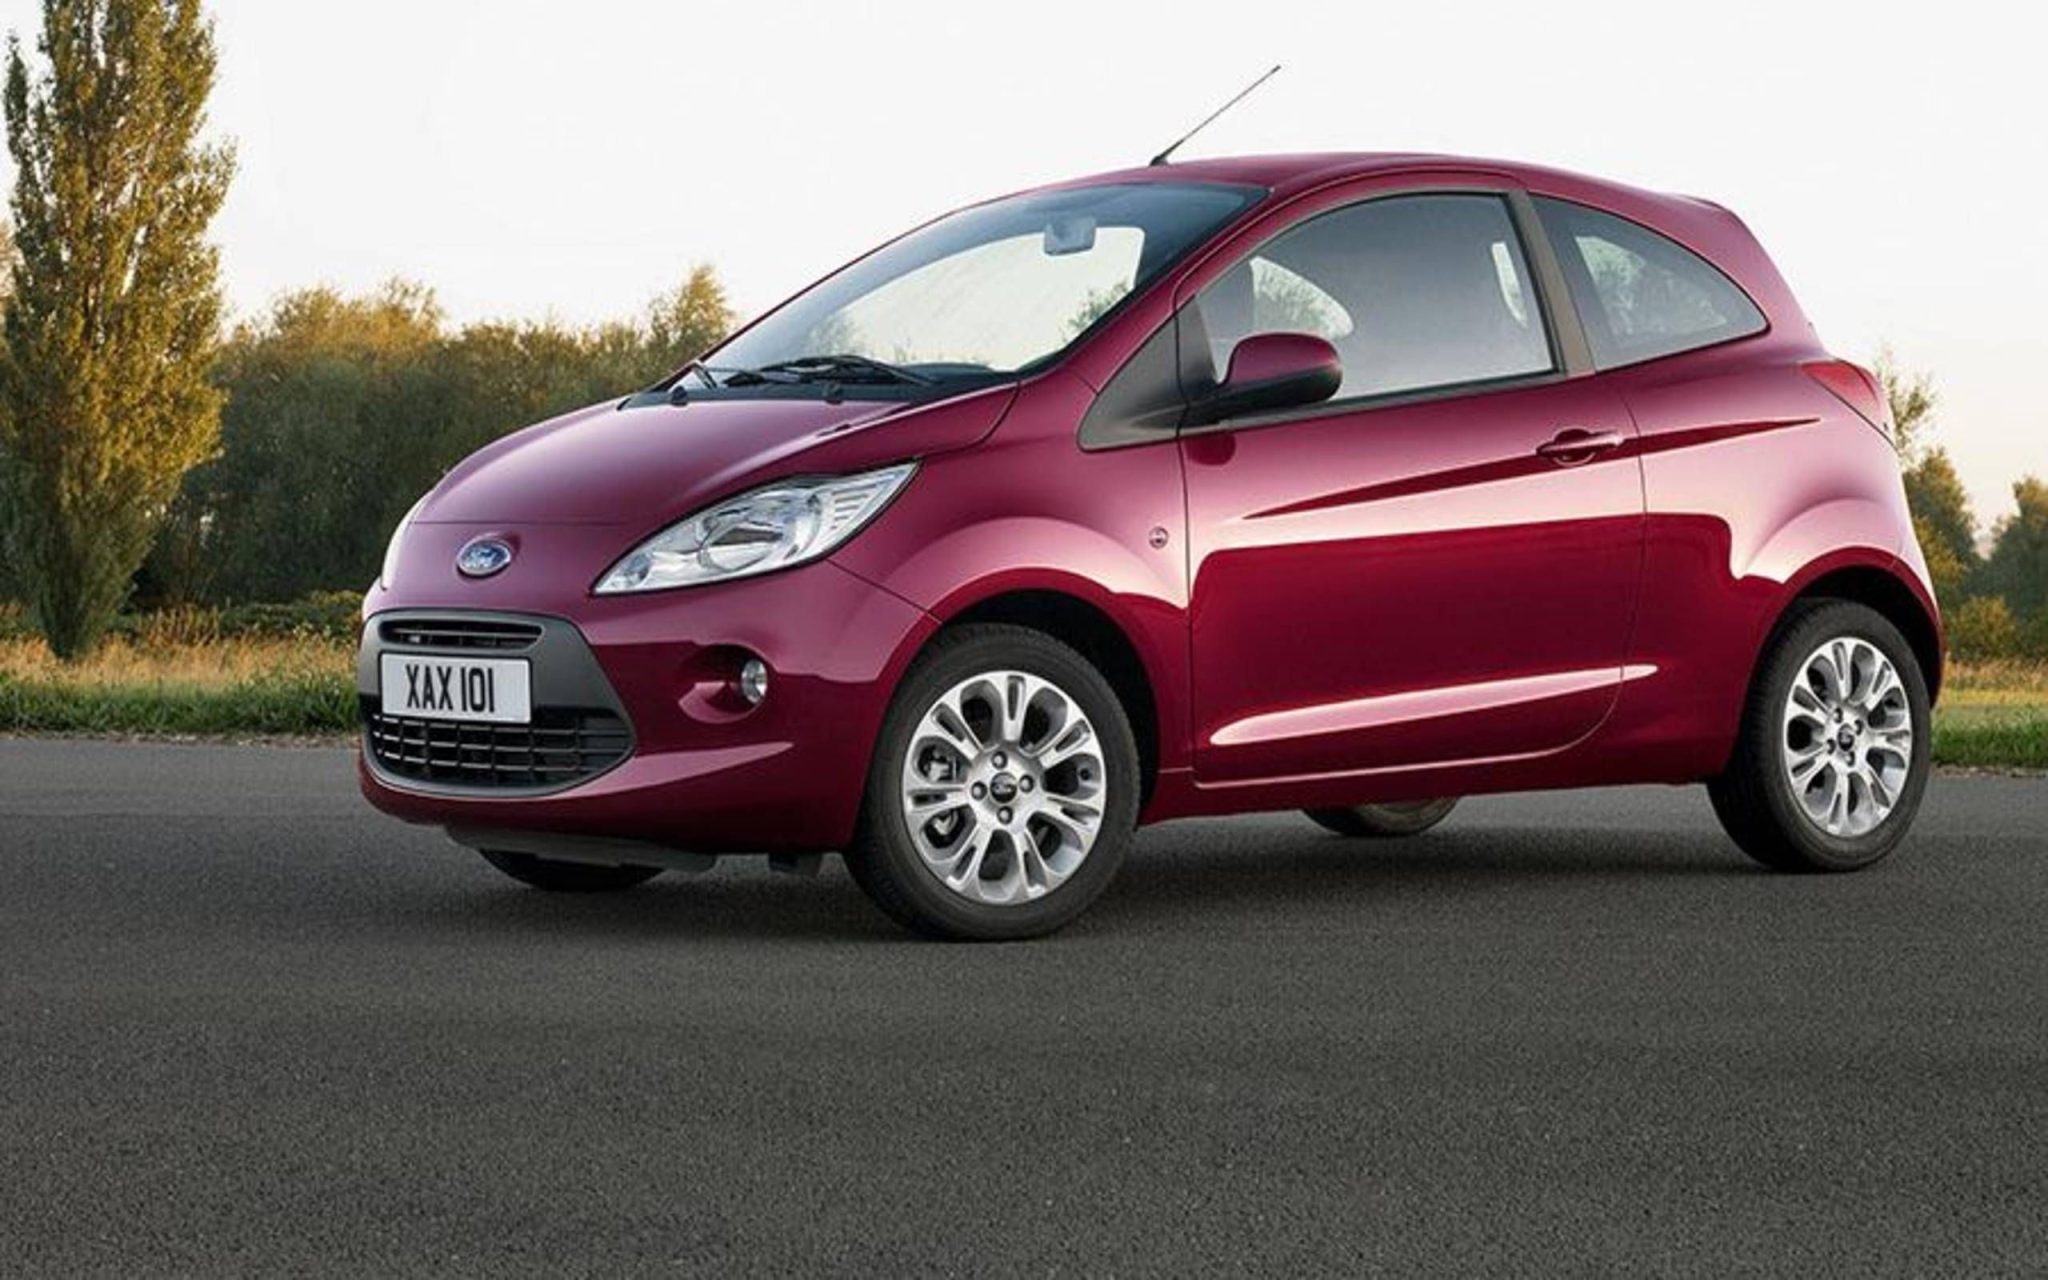
The Ford Ka is a city car that was first introduced in 1996. It is currently in its third generation, which was introduced in 2016. The Ka is known for its affordability, fuel efficiency, and maneuverability. The current-generation Ka is available with a choice of two engines: a 1.2-liter naturally-aspirated three-cylinder engine and a 1.0-liter turbocharged three-cylinder engine. Both engines are mated to a five-speed manual transmission. The Ka is available in a variety of trim levels, including the base Studio, the mid-level Zetec, and the top-of-the-line ST-Line. The Ka is a popular car in Europe. It has won numerous awards, including the 2017 What Car? City Car of the Year award.
Ford Ka Europe Sales Data & Charts
These statistics exclude sales of the Ford StreetKa roadster.
Europe Annual Sales
| Year | Sales Units |
|---|---|
| 1997 | 202,316 |
| 1998 | 206,137 |
| 1999 | 161,727 |
| 2000 | 146,861 |
| 2001 | 137,063 |
| 2002 | 134,427 |
| 2003 | 97,428 |
| 2004 | 78,771 |
| 2005 | 68,987 |
| 2006 | 61,745 |
| 2007 | 52,139 |
| 2008 | 47,646 |
| 2009 | 108,342 |
| 2010 | 93,890 |
| 2011 | 73,769 |
| 2012 | 59,115 |
| 2013 | 50,012 |
| 2014 | 52,854 |
| 2015 | 48,368 |
| 2016 | 21,333 |
| 2017 | 204 |
| 2018 | 16 |