
Ford C-Max
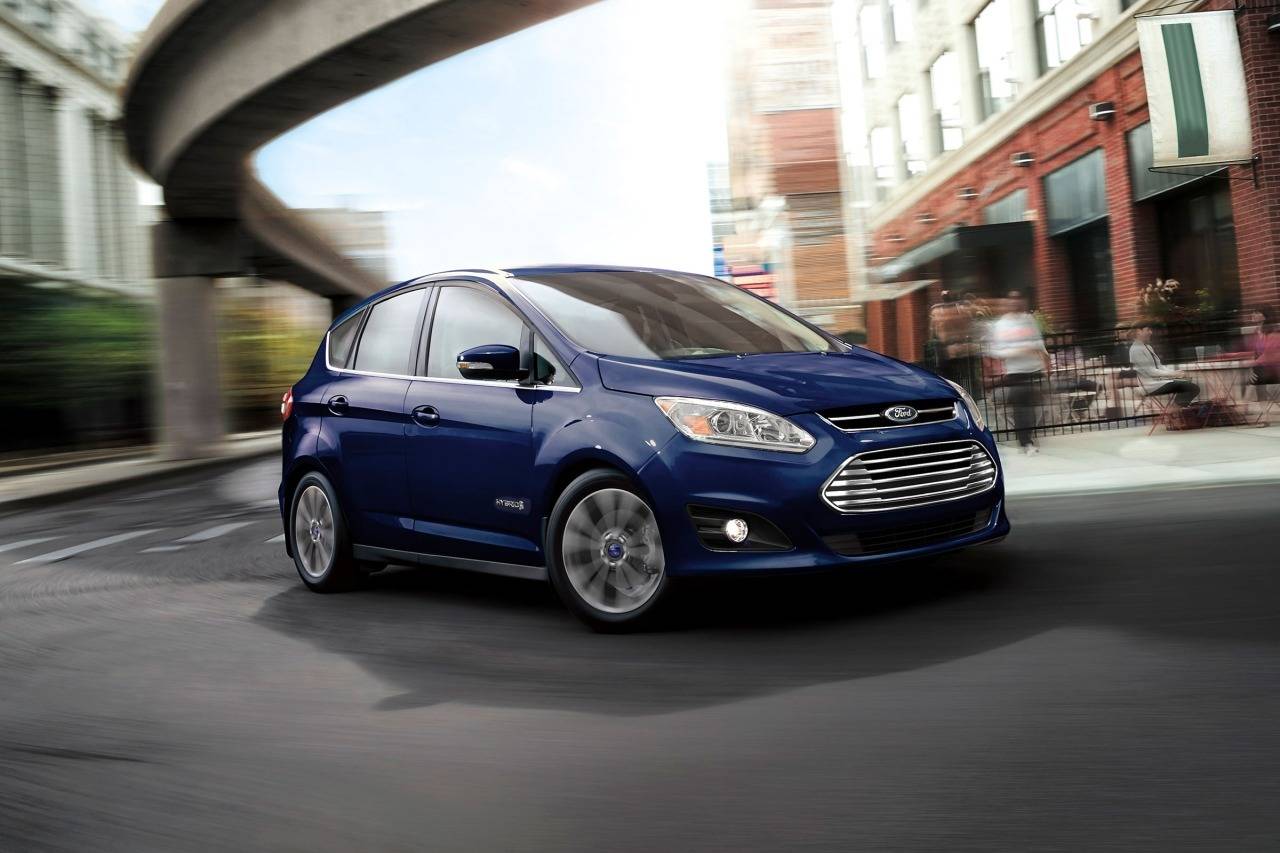
Here you will find monthly and yearly Canadian, European and U.S. sales figures for the Ford C-Max. The Ford C-Max is a compact multi-purpose vehicle (MPV) produced by the American automaker Ford. Introduced in Europe in 2003, the C-Max was Ford’s entry into the growing market for MPVs, which are smaller than traditional minivans but larger and more versatile than typical compact cars. The C-Max was known for its fuel efficiency, spacious interior, and comfortable ride.
Ford C-Max Overview
The C-Max was launched in Europe in 2003 as the Ford Focus C-Max, signaling its close relationship with the Ford Focus upon which it’s based. Originally designed for European consumers where MPVs are popular, the C-Max was later introduced to the North American market in hybrid and plug-in hybrid versions.
The Ford C-Max’s blend of compact dimensions, versatility, and efficient powertrains made it an attractive option for urban families and eco-conscious drivers. It catered to a segment of consumers looking for something between a compact car and a larger SUV or minivan. However, with the global shift towards SUVs and crossovers and a decreasing demand for MPVs, the C-Max was eventually phased out in various markets.
The first-generation C-Max was available with a choice of two engines: a 1.6-liter four-cylinder engine and a 2.0-liter four-cylinder engine. Both engines were mated to a six-speed manual transmission or a six-speed automatic transmission. The second-generation C-Max was available with a choice of three engines: a 1.0-liter turbocharged three-cylinder engine, a 1.5-liter turbocharged three-cylinder engine, and a 1.6-liter turbocharged four-cylinder engine. All three engines were mated to a six-speed automatic transmission. The C-Max was available in a variety of trim levels, including the base Zetec, the mid-level Titanium, and the top-of-the-line Vignale.
The C-Max was a popular car in Europe and North America. It was discontinued in 2019 due to declining sales.
Ford C-Max Sales Figures
Ford C-Max U.S Sales Data & Charts
US Annual Sales
| Year | Sales Units |
|---|---|
| 2012 | 13,309 |
| 2013 | 35,210 |
| 2014 | 27,595 |
| 2015 | 21,768 |
| 2016 | 19,834 |
| 2017 | 18,390 |
| 2018 | 6,683 |
| 2019 | 49 |
US Annual Growth
Ford C-Max Canada Sales Data & Charts
Canada Annual Sales
| Year | Sales Units |
|---|---|
| 2012 | 155 |
| 2013 | 1,383 |
| 2014 | 1,411 |
| 2015 | 721 |
| 2016 | 851 |
| 2017 | 1,414 |
| 2018 | 209 |
Canada Annual Growth
Ford C-Max Europe Sales Data & Charts
Europe Annual Sales
| Year | Sales Units |
|---|---|
| 2012 | 13,309 |
| 2013 | 35,210 |
| 2014 | 27,595 |
| 2015 | 21,768 |
| 2016 | 19,834 |
| 2017 | 1,839 |
| 2018 | 6,683 |
| 2019 | 38 |
Europe Annual Growth
Ford C-Max Generations
First Generation (2003-2010)
Initially called the Ford Focus C-Max, this model offered a roomy interior and practicality. It had sliding rear doors for easy access and came with a variety of gasoline and diesel engine options.
Second Generation (2010-2019)
The “Focus” moniker was dropped, and it was simply called the Ford C-Max. This generation expanded the lineup with the Grand C-Max, a longer variant with seven seats. In the U.S., the C-Max was introduced as a hybrid and later as a plug-in hybrid called the C-Max Energi.


Open letter to Ford:
I thought my 2013 C-MAX would be a Prius Killer? NOT! As a returning Ford buyer I feel deceived. I want to support US companies and US jobs. What was Ford thinking when they published 47/ 47/47 estimates? Based on the advertised EPA estimates, I would have been ok with low 40's but 28-33 mpg is not even in the ballpark. This is not an issue about EPA testing standards, but rather an issue about setting false customer expectations in order to promote sales. Ford's "47MPG" marketing campaign tarnished what should have been the roll out of a truly remarkable vehicle, the CMAX. Real world MPG estimates should have been promoted in the mid-30's. No one would have questioned those numbers and the CMAX would have received the accolades it deserves. How these MPG estimates made it through Ford corporate is beyond me! Maybe it was the rush to go to market? I have been accused of not knowing how to drive hybrid. For the record, during the last three years I have leased both a 2010 Prius and 2010 Honda Insight Hybrid, and consider myself an experienced hyper-miler. My mileage in the Prius is 50 plus, the Insight is 40 plus. The C-MAX is a well-built car, with extremely inflated EPA estimates. I respectfully request that this matter be investigated as soon as possible. My efforts to deal with this locally and through Ford customer service have frustrated me to no end. The constant response? "You need to learn to how to drive hybrid type of vehicle ". Is there a difference how I drive Prius Hybrid vs. the CMAX hybrid? I think we all know the answer to that. I need someone at Ford to reach out to me and assist in a proactive manner so we can put this matter to rest.
Ronald Kramer Yankee Ford Customer
South Portland, Maine