Ford B-Max Sales Data & Trends
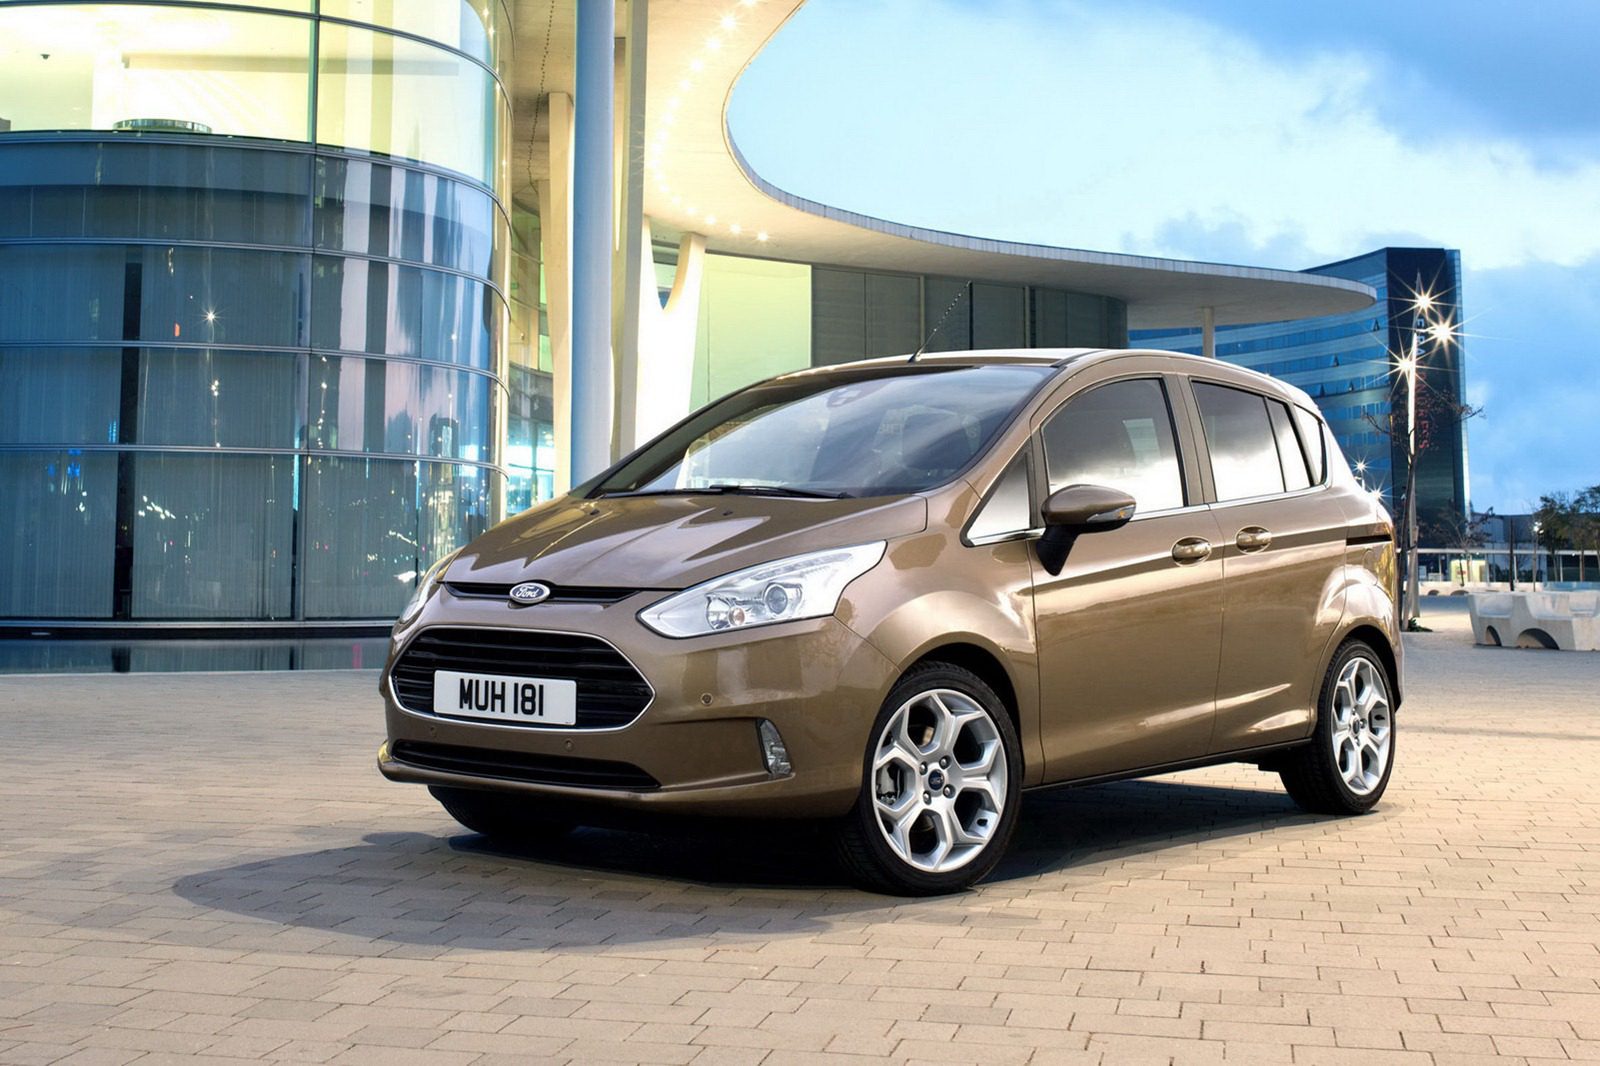
The Ford B-Max is a compact MPV (multi-purpose vehicle) that was produced by Ford Europe from 2012 to 2017. It was based on the Ford Fiesta platform and was designed to be a more practical and versatile alternative to the Ford C-Max. The B-Max was available with a choice of two engines: a 1.4-liter naturally-aspirated four-cylinder engine and a 1.6-liter turbocharged four-cylinder engine. Both engines were mated to a six-speed manual transmission. The B-Max was available with front-wheel drive or all-wheel drive configurations. It had a top speed of 112 mph and could accelerate from 0 to 60 mph in 11.5 seconds.
The B-Max was known for its innovative design, which featured rear-hinged rear doors that allowed for easy access to the rear seats. It also featured a number of practical features, such as a fold-flat front passenger seat and a large cargo area. The B-Max was a popular car in Europe, but it was not sold in the United States. It was discontinued in 2017 due to declining sales.
Ford B-Max Europe Sales Data & Charts
Europe Annual Sales
| Year | Sales Units |
|---|---|
| 2012 | 15,871 |
| 2013 | 68,557 |
| 2014 | 53,889 |
| 2015 | 46,147 |
| 2016 | 40,474 |
| 2017 | 43,339 |
| 2018 | 3,545 |
| 2019 | 3 |