
Fiat Qub
The Fiat Qubo is a compact minivan produced by the Italian automobile manufacturer Fiat since 2008. It is based on the Fiat Panda platform. The Qubo is available with a variety of petrol and diesel engines, with power outputs ranging from 70 horsepower to 105 horsepower. It is also available with a variety of features, such as a sunroof, a navigation system, and a Bose sound system.
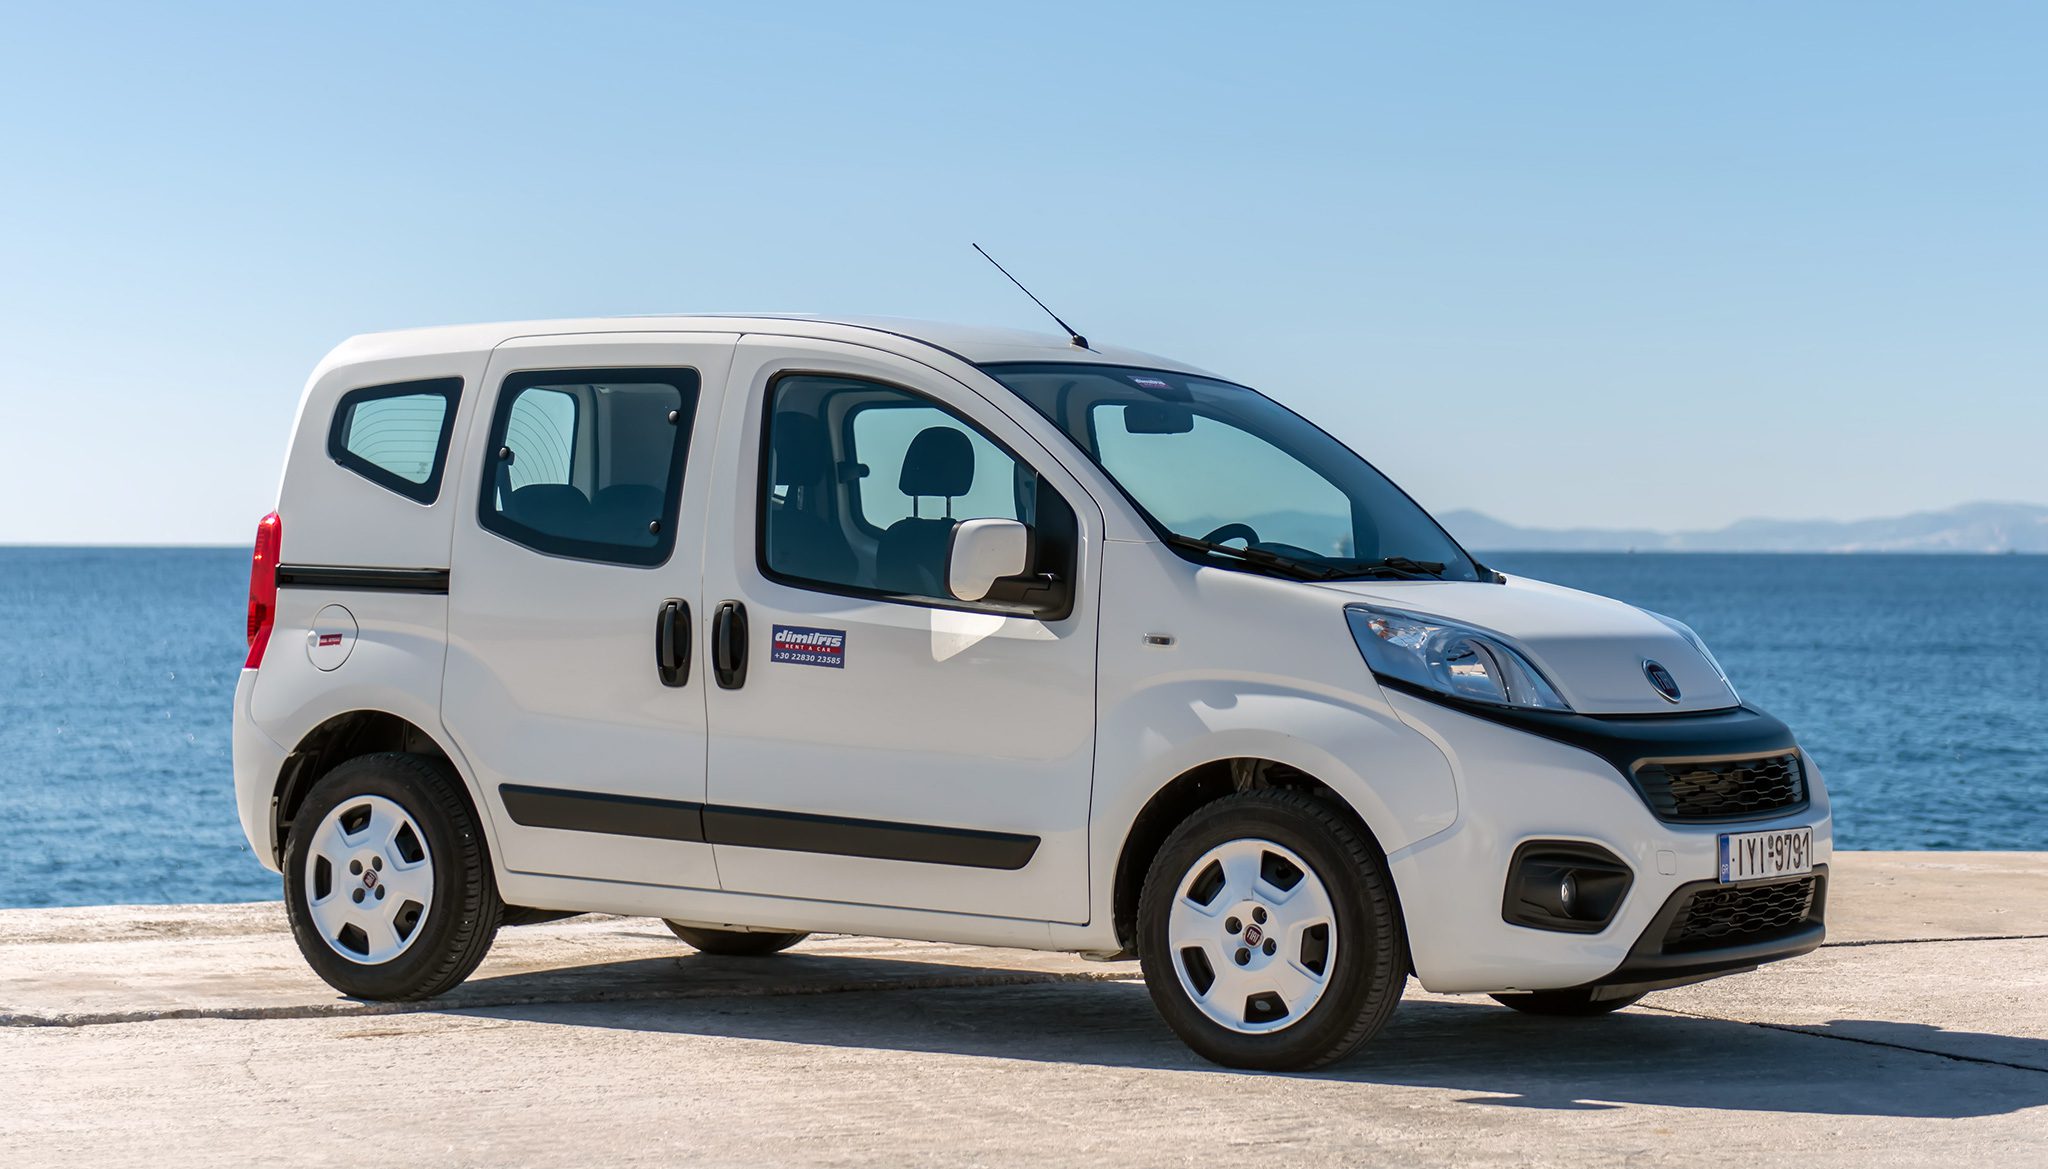
The Qubo is distinguished by its boxy design and its spacious interior. It is also available with a variety of features, such as a sliding side door and a fold-flat passenger seat. The Qubo is not a commercial success, with only over 100,000 units being produced. However, it has been well-received by critics, who praised its design, interior space, and fuel efficiency.


