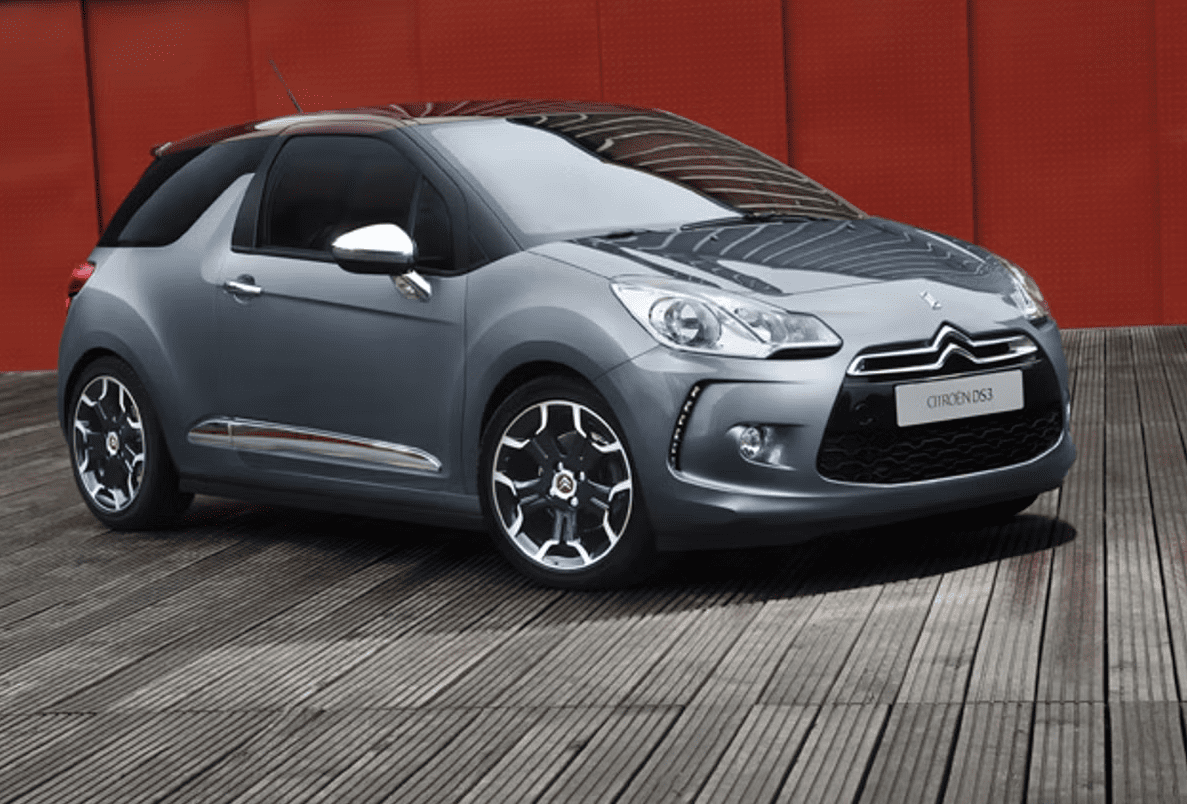
DS3-auto-sales-statistics-EuropeMonthly and annual sales figures for the DS3 in Europe.

See how DS3 sales compare to the other models in the subcompact segment.


DS
DS3
2016
DS
DS3
2017
DS
DS3
2018
DS
DS3
2019
DS
DS3
2020
January 3.337 2.061 1.557 711 1
February 2.823 1.691 1.455 503 2
March 6.078 4.228 3.591 1.264 1
April 3.464 1.845 2.153 665 1
May 3.061 2.311 1.514 648 1
June 4.447 2.799 2.424 811 3
July 2.775 2.218 1.378 387 1
August 1.495 1.412 737 281 1
September 4.438 2.970 991 299 1
October 2.191 2.032 746 194
November 2.311 2.259 702 261
December 2.270 2.016 562 468

DS
DS3
2020 12
2019 6.492
2018 17.810
2017 27.842
2016 38.690
2015 45.665
2014 53.074
2013 65.454
2012 64.077
2011 72.876
2010 53.223
2009 205


DS3 Convertible sales (also included in above figures):

  DS3 Convertible
2014 0
2015 3.051
2016 2.750

Use the dropdown at the top right of this page to find sales figures for any other car model sold in Europe since the early 2000’s.

Car sales statistics are from the following countries: Austria, Belgium, Cyprus, Czech Republic, Denmark, Estonia, Finland, France, Germany, Great Britain, Greece, Hungary, Iceland, Ireland, Italy, Latvia, Lithuania, Luxembourg, Netherlands, Norway, Poland, Portugal, Romania, Slovakia, Slovenia, Spain, Sweden, Switzerland. Sources: Manufacturers, ANDC, JATO Dynamics.

DS
DS3
2016
DS
DS3
2017
DS
DS3
2018
DS
DS3
2019
DS
DS3
2020
January 3.337 2.061 1.557 711 1
February 2.823 1.691 1.455 503 2
March 6.078 4.228 3.591 1.264 1
April 3.464 1.845 2.153 665 1
May 3.061 2.311 1.514 648 1
June 4.447 2.799 2.424 811 3
July 2.775 2.218 1.378 387 1
August 1.495 1.412 737 281 1
September 4.438 2.970 991 299 1
October 2.191 2.032 746 194
November 2.311 2.259 702 261
December 2.270 2.016 562 468

DS
DS3
2020 12
2019 6.492
2018 17.810
2017 27.842
2016 38.690
2015 45.665
2014 53.074
2013 65.454
2012 64.077
2011 72.876
2010 53.223
2009 205