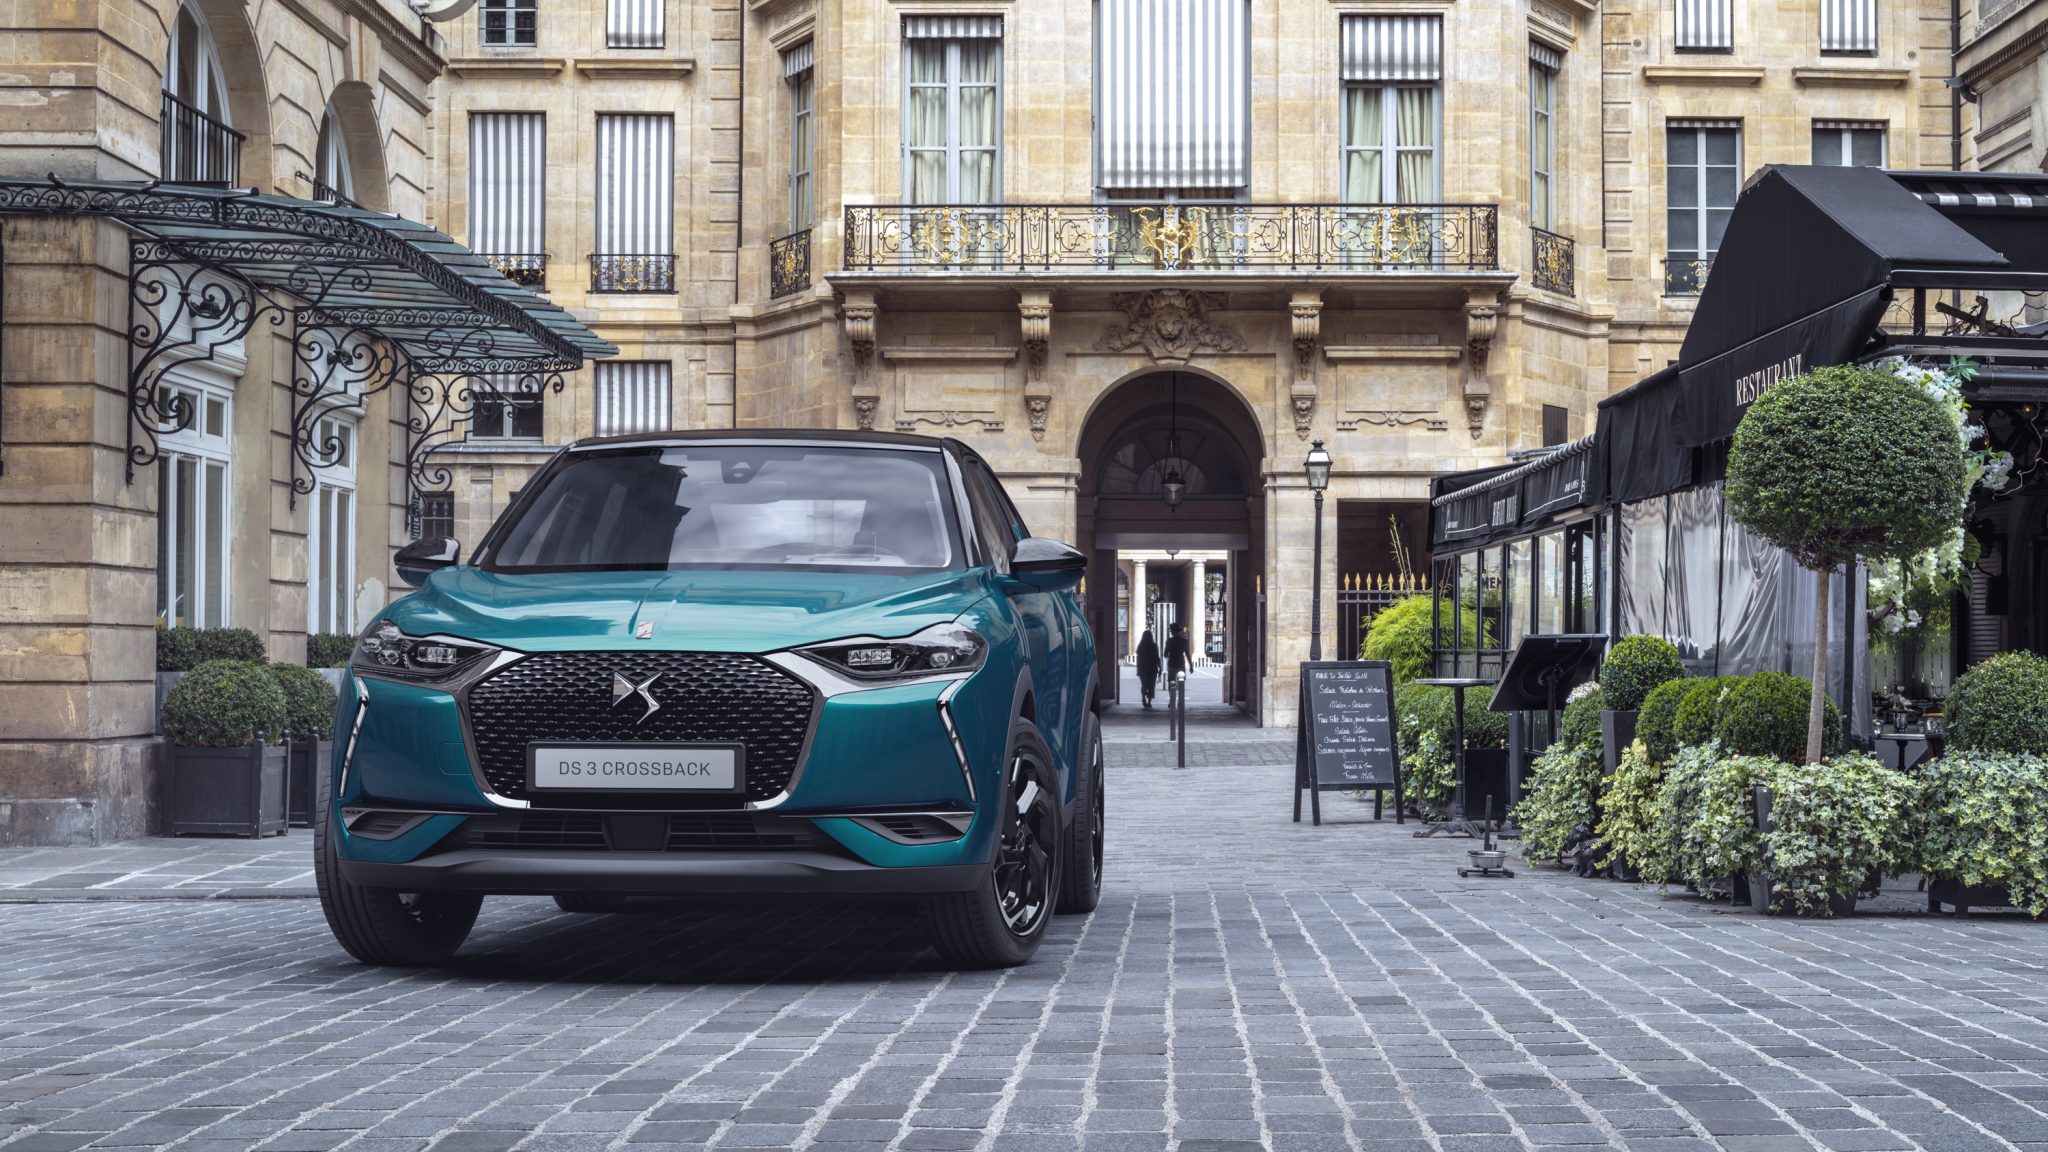
Monthly and annual sales figures for the DS3 Crossback in Europe.
Related model: Peugeot 2008 II, Opel/Vauxhall Mokka B
See how DS3 Crossback sales compare to the other models in the small crossover segment.
DSDS3 Crossback2019 |
DSDS3 Crossback2020 |
DSDS3 Crossback2021 |
DSDS3 Crossback2022 |
|
January | 124 | 2.407 | 991 | 889 |
February | 147 | 2.331 | 1.152 | 940 |
March | 286 | 1.087 | 1.828 | 1.450 |
April | 394 | 640 | 1.315 | 612 |
May | 1.611 | 849 | 1.263 | 972 |
June | 2.637 | 1.829 | 2.053 | 1.329 |
July | 1.976 | 2.064 | 1.484 | 1.402 |
August | 1.589 | 1.167 | 739 | 1.133 |
September | 1.688 | 1.882 | 1.494 | 1.098 |
October | 2.855 | 1.727 | 1.157 | 1.132 |
November | 2.206 | 1.606 | 1.078 | 1.266 |
December | 2.315 | 1.907 | 1.354 |
DSDS3 Crossback |
|
2021 | 15.908 |
2020 | 19.496 |
2019 | 17.828 |
2018 | 143 |
Use the dropdown at the top right of this page to find sales figures for any other car model sold in Europe since the early 2000’s.
Car sales statistics are from the following countries: Austria, Belgium, Cyprus, Czech Republic, Denmark, Estonia, Finland, France, Germany, Great Britain, Greece, Hungary, Iceland, Ireland, Italy, Latvia, Lithuania, Luxembourg, Netherlands, Norway, Poland, Portugal, Romania, Slovakia, Slovenia, Spain, Sweden, Switzerland. Sources: Manufacturers, ANDC, JATO Dynamics.
DSDS3 Crossback2019 |
DSDS3 Crossback2020 |
DSDS3 Crossback2021 |
DSDS3 Crossback2022 |
|
January | 124 | 2.407 | 991 | 889 |
February | 147 | 2.331 | 1.152 | 940 |
March | 286 | 1.087 | 1.828 | 1.450 |
April | 394 | 640 | 1.315 | 612 |
May | 1.611 | 849 | 1.263 | 972 |
June | 2.637 | 1.829 | 2.053 | 1.329 |
July | 1.976 | 2.064 | 1.484 | 1.402 |
August | 1.589 | 1.167 | 739 | 1.133 |
September | 1.688 | 1.882 | 1.494 | 1.098 |
October | 2.855 | 1.727 | 1.157 | 1.132 |
November | 2.206 | 1.606 | 1.078 | 1.266 |
December | 2.315 | 1.907 | 1.354 |
DSDS3 Crossback |
|
2021 | 15.908 |
2020 | 19.496 |
2019 | 17.828 |
2018 | 143 |