
Citroën C5
The Citroën C5 is a mid-size family car that was produced by Citroën from 2001 to 2017. It was replaced by the Citroën C5 Aircross. The C5 was powered by a variety of engines, including four-cylinder and six-cylinder petrol engines, and four-cylinder diesel engines. It was available with either a front-wheel drive or all-wheel drive system. The C5 was available in three body styles: a sedan, a hatchback, and a wagon. It was praised for its comfortable ride, spacious interior, and innovative features. The Citroën C5 was discontinued in 2017.
Citroën C5 Overview
The Citroën C5 is a large family car produced by the French automaker Citroën. It has been part of Citroën’s lineup since its introduction in 2000 and has seen multiple generations and iterations over the years. The C5 is known for its comfort, typical of many Citroën models, and its unique suspension system in earlier versions.
The first-generation C5 showcased a mix of hatchback and sedan body styles, something Citroën referred to as a “fastback”. One of the notable features of this generation was the Hydractive 3 suspension system, an evolution of Citroën’s historic hydropneumatic system. This provided a cloud-like ride and the ability to adjust the car’s ride height.
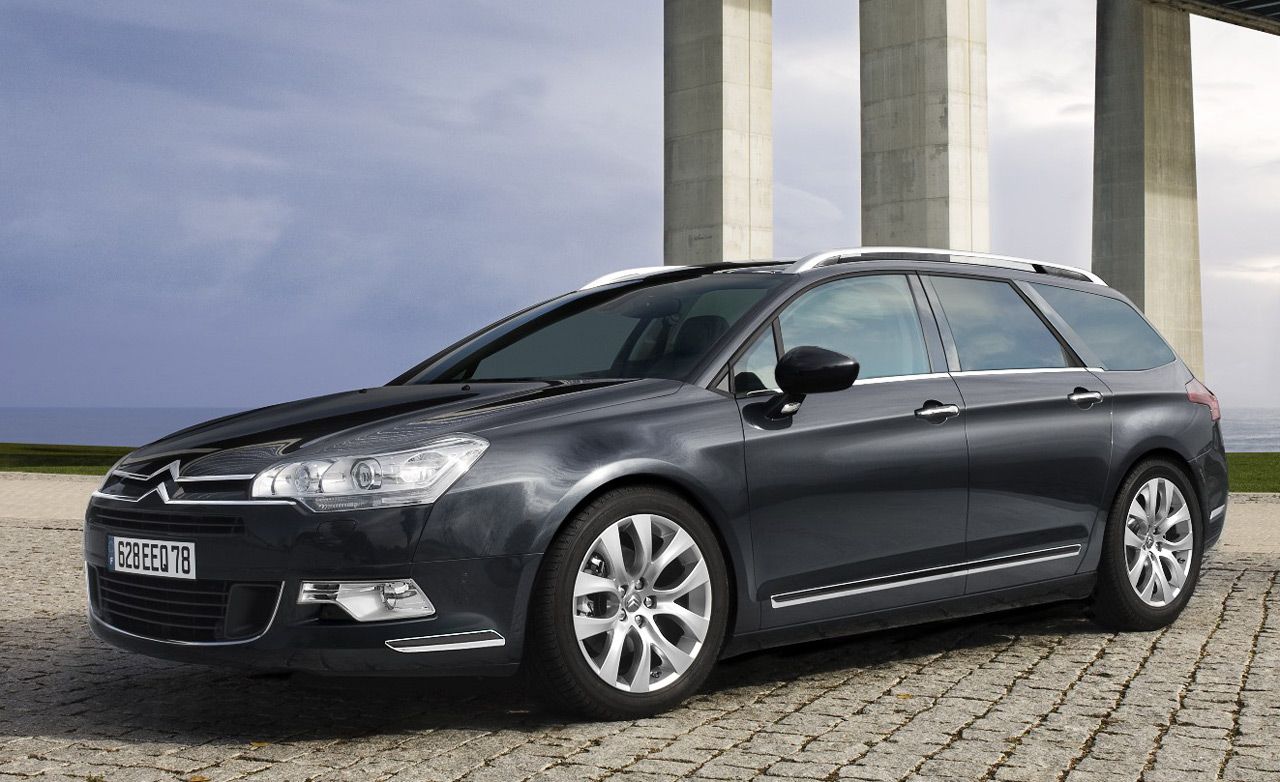
In 2008, the second-gen C5 adopted a more conventional sedan shape, moving away from the previous “fastback” design. There was also an estate version available. This generation saw the introduction of various technological and comfort features, including lane departure warning systems, bi-xenon directional headlamps, and more. The Hydractive suspension continued to feature, though later in its lifecycle, traditional steel springs became standard on base models, with the hydropneumatic system reserved for higher trims.
After the discontinuation of the second-gen C5, Citroën unveiled the C5 X in 2021. It’s a blend of a sedan and a station wagon, with some crossover elements – a testament to modern car design trends. The C5 X features a bold design with a long wheelbase, high ground clearance, and a fastback roofline. The C5 X employs Citroën’s Progressive Hydraulic Cushions suspension, aiming to offer a magic-carpet-like ride, reminiscent of the brand’s hydropneumatic heritage.
Citroën C5 Sales Figures
Citroën C5 Europe Sales Data & Charts
Europe Annual Sales
| Year | Sales Units |
|---|---|
| 2000 | 99 |
| 2001 | 109,657 |
| 2002 | 145,731 |
| 2003 | 105,299 |
| 2004 | 89,437 |
| 2005 | 84,506 |
| 2006 | 6,564 |
| 2007 | 46,853 |
| 2008 | 71,187 |
| 2009 | 81,288 |
| 2010 | 71,420 |
| 2011 | 57,873 |
| 2012 | 37,930 |
| 2013 | 24,841 |
| 2014 | 18,064 |
| 2015 | 13,480 |
| 2016 | 9,464 |
| 2017 | 4,939 |
| 2018 | 151 |
| 2019 | 4 |
Europe Annual Growth
Citroën C5 China Sales Data & Charts
China Annual Sales
| Year | Sales Units |
|---|---|
| 2010 | 35,001 |
| 2011 | 33,678 |
| 2012 | 35,242 |
| 2013 | 39,021 |
| 2014 | 33,872 |
| 2015 | 21,699 |
| 2016 | 5,042 |
| 2017 | 8,323 |
| 2018 | 5,070 |
| 2019 | 725 |
| 2020 | 25 |


