
Chevrolet Spark
The Chevrolet Spark is a subcompact hatchback produced by Chevrolet, a division of General Motors. Originally starting life as the Daewoo Matiz in the late 1990s, it was rebadged and introduced to various markets as the Chevrolet Spark. Designed as an affordable, efficient, and city-friendly car, the Spark has been a popular choice for urban commuters and those looking for a budget-friendly vehicle. The Spark is a good choice for those looking for a fuel-efficient and affordable subcompact car. It is also a good choice for those who are looking for a car with a small footprint and easy to park.
Chevrolet Spark Overview
The Chevrolet Spark began as the Daewoo Matiz, produced by the South Korean manufacturer Daewoo. After General Motors took over Daewoo, the Matiz was rebranded and introduced to various global markets under different names, with “Chevrolet Spark” being one of the primary monikers.
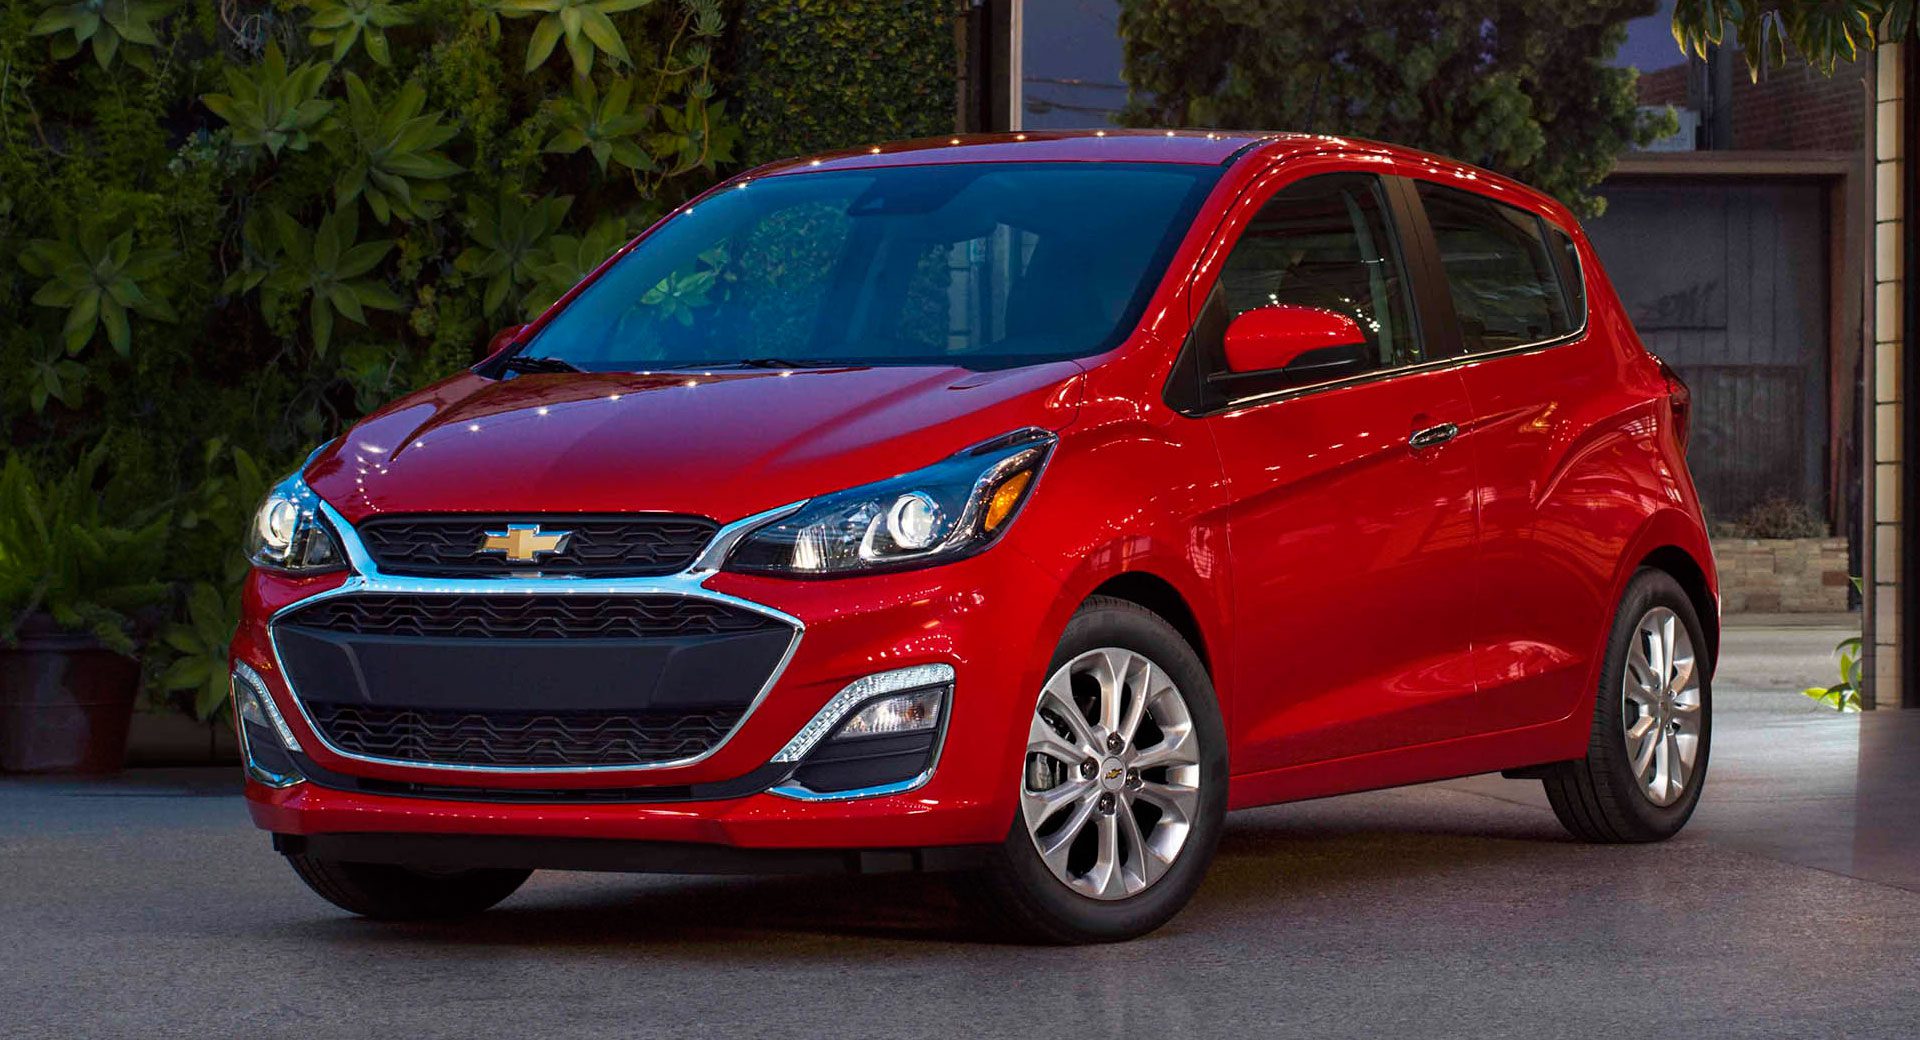
The Spark is a small, five-door hatchback with a compact design ideal for city driving and parking in tight spaces. Over the years and generations, the Spark has undergone various design changes, adopting Chevrolet’s evolving design language. Given its budget-friendly positioning, the Spark’s interior is functional and straightforward, though newer models have seen enhancements in materials and tech features. Modern versions of the Spark come with features like touchscreen infotainment systems, smartphone integration, and a range of safety features.
The Spark is available with a choice of one engine: a 1.4L four-cylinder engine that produces 98 horsepower and 94 lb-ft of torque. It is available with a continuously variable automatic transmission (CVT). The Spark is known for its fuel efficiency. It gets an EPA-estimated 31 mpg in the city and 41 mpg on the highway. The Spark is also known for its affordability. It starts at $14,500, which is one of the lowest starting prices in the subcompact car class. The Spark comes standard with a variety of features, including a 7-inch touchscreen infotainment system, a rearview camera, and Bluetooth connectivity. Available features include a 6-speaker sound system, a sunroof, and a heated steering wheel.
Chevrolet Spark Sales Figures
The Chevrolet Spark, in general, has been well-received for its value proposition, fuel efficiency, and city-friendly design. However, it has also faced criticisms in areas like highway performance and interior space when compared to larger vehicles. The Chevrolet Spark has been sold in numerous markets worldwide. Its affordability and efficiency make it particularly popular in developing markets and regions with dense urban areas. In some markets, the car has been sold under different names, such as the Chevy Beat in India.
Chevrolet Spark US Sales Data & Charts
US Annual Sales
| Year | Sales Units |
|---|---|
| 2012 | 12,385 |
| 2013 | 34,130 |
| 2014 | 39,159 |
| 2015 | 32,853 |
| 2016 | 35,511 |
| 2017 | 22,589 |
| 2018 | 23,603 |
| 2019 | 31,280 |
| 2020 | 33,480 |
| 2021 | 24,460 |
| 2022 | 13,708 |
| 2023 | 149 |
US Annual Growth
Chevrolet Spark Canada Sales Data & Charts
Canada Annual Sales
Year Sales Units
2012
933
2013
2,550
2014
1,577
2015
1,561
2016
3,657
2017
3,982
2018
4,945
2019
5,483
2020
6,291
2021
6,146
Canada Annual Growth
Chevrolet Spark Europe Sales Data & Charts
These statistics include sales of the Daewoo Matiz from 1999-2004, which was renamed Chevrolet Matiz from 2005-2009 and the Chevrolet Spark from 2009 onwards. The Daewoo brand was renamed Chevrolet in Europe at the end of 2004 / start of 2005 when GM bought the bankrupt Korean automaker.
Europe Annual Sales
| Year | Sales Units |
|---|---|
| 1999 | 90,524 |
| 2000 | 104,481 |
| 2001 | 69,106 |
| 2002 | 58,640 |
| 2003 | 50,539 |
| 2004 | 79,409 |
| 2005 | 73,189 |
| 2006 | 61,456 |
| 2007 | 67,352 |
| 2008 | 65,562 |
| 2009 | 78,748 |
| 2010 | 73,769 |
| 2011 | 65,205 |
| 2012 | 46,562 |
| 2013 | 37,268 |
| 2014 | 10,138 |
| 2015 | 479 |
| 2016 | 96 |
| 2017 | 2 |
| 2018 | 3 |
Europe Annual Growth
Chevrolet Spark China Sales Data & Charts
Car sales statistics from China only include domestic production and exclude imported models.
China Annual Sales
| Year | Sales Units |
|---|---|
| 2003 | 213 |
| 2004 | 10,142 |
| 2005 | 26,900 |
| 2006 | 39,628 |
| 2007 | 32,510 |
| 2008 | 40,797 |
| 2009 | 60,000 |
| 2010 | 77,800 |
| 2011 | 70,258 |
| 2012 | 42,216 |


If we check its sales figure,its graph is rising and its a good sign for the Chevrolet. The all new Spark facelift looks more refined and compact and a perfect choice for urban users.