
Chevrolet Corvette
Here you will find monthly and yearly Canadian, U.S. and Europe market sales figures for the Chevrolet Corvette. Almost everything that follows below in this section comes from the official press releases by GM (and other major trade publications) about the 2020 Mid-Engine Corvette. Just the same, it is important to understand that many elements developed during the evolution of the Corvette were based on the nearly endless input and feedback from the global Corvette community. While the C8 Corvette was going to be a complete departure from the cars that came before it, the evolution of Corvette’s engine program from the mid-1990’s on has given birth to some of the most powerful and durable small-block engines in the history of Chevrolet. As such, a lot of consideration was given to incorporating those “lessons learned” when selecting/developing the powerplant for the next-generation Corvette.
Chevrolet Corvette Overview
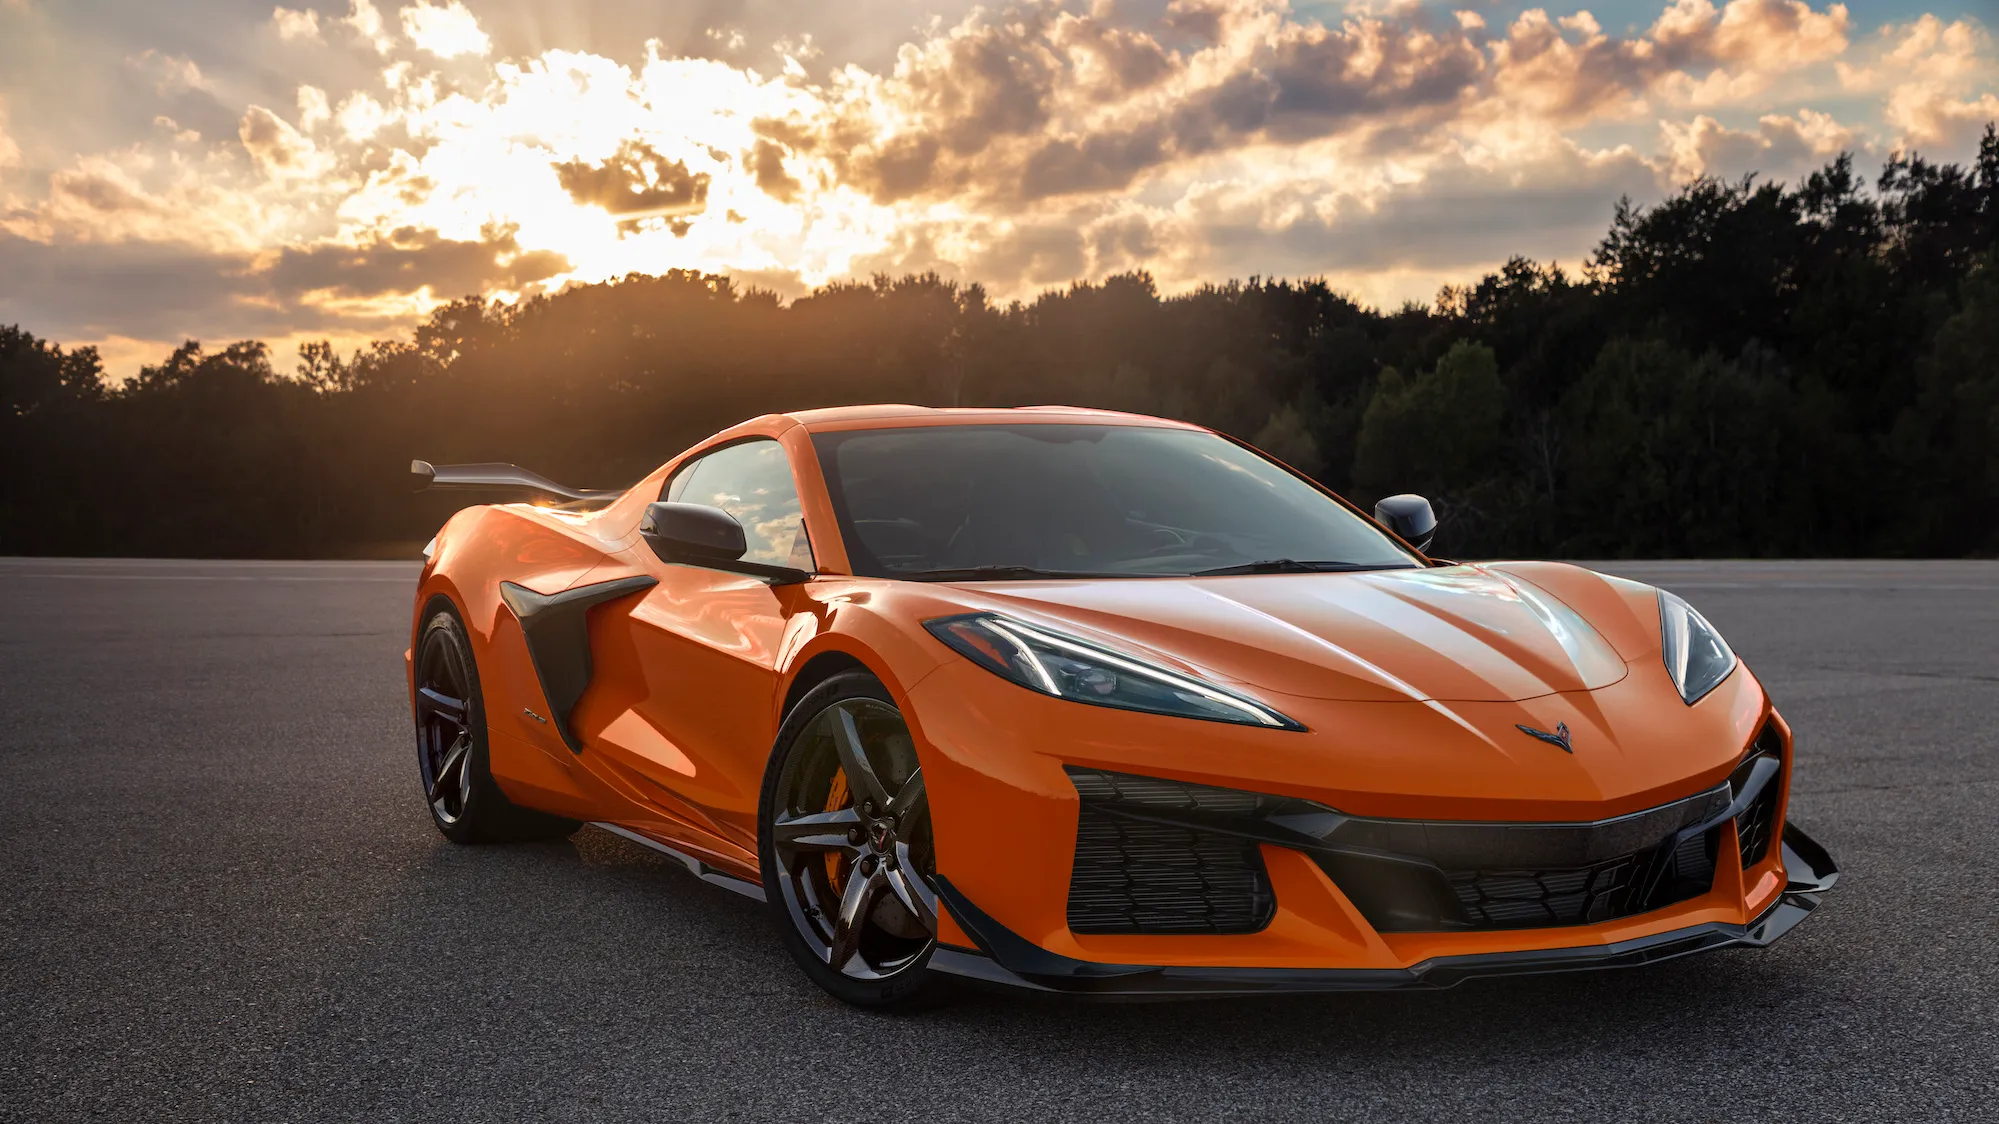
The current Corvette is the eighth generation, also known as the C8. It was introduced in 2020 and is the first Corvette to be mid-engined, powered by a 6.2L LT2 V8 engine that produces 490 horsepower and 465 lb-ft of torque. It is available in two trims: Stingray and Z06. The Stingray starts at $59,995 and the Z06 starts at $86,995.
Chevrolet Corvette Sales Figures
Chevrolet Corvette U.S Sales Data & Charts
US Monthly Sales
US Annual Sales
| Year | Sales Units |
|---|---|
| 2005 | 32,489 |
| 2006 | 36,518 |
| 2007 | 33,685 |
| 2008 | 26,971 |
| 2009 | 13,934 |
| 2010 | 12,624 |
| 2011 | 13,164 |
| 2012 | 15,059 |
| 2013 | 17,291 |
| 2014 | 34,839 |
| 2015 | 33,329 |
| 2016 | 29,995 |
| 2017 | 25,079 |
| 2018 | 18,789 |
| 2019 | 17,988 |
| 2020 | 21,627 |
| 2021 | 33,042 |
| 2022 | 37,510 |
| 2023 | 34,354 |
| 2024 | 8,576 |
US Annual Growth
Chevrolet Corvette Canada Sales Data & Charts
Canada Annual Sales
Year Sales Units
2012
250
2013
324
2014
1,181
2015
2,040
2016
1,758
2017
2,016
2018
1,554
2019
1,569
2020
1,811
2021
2,261
Canada Annual Growth
Chevrolet Corvette Europe Sales Data & Charts
Europe Annual Sales
| Year | Sales Units |
|---|---|
| 2000 | 943 |
| 2001 | 928 |
| 2002 | 781 |
| 2003 | 595 |
| 2004 | 21 |
| 2005 | 940 |
| 2006 | 1,187 |
| 2007 | 1,239 |
| 2008 | 1,050 |
| 2009 | 388 |
| 2010 | 596 |
| 2011 | 381 |
| 2012 | 191 |
| 2013 | 158 |
| 2014 | 577 |
| 2015 | 794 |
| 2016 | 762 |
| 2017 | 613 |
| 2018 | 557 |
| 2019 | 672 |
| 2020 | 5 |
| 2021 | 258 |
| 2022 | 743 |


OK Chevy will give us the Hybrid E Ray in a few years for something north of $100,000 for a nicely equipped model. I happen to own a Beautiful 2014 Z51 with 10,000 miles and I am just not able or willing to take a dive on my baby and pony up $60,000 or more for the E-Ray. However, I would be the first one in line with cash to sign up for a Hybrid retrofit Of my current C7 Corvette as I see being done successfully in France and the UK. Their in Wheel Motors are all of 17 inches in Diameter and 5 inches wide. They are two version from one supplier that produce 50 HP per wheel or 120 HP per wheel. Running off 48 volts and providing power for short errants or clean city driving is available. Are you able to help us learn about these systems and how we can go about recruiting them to America.