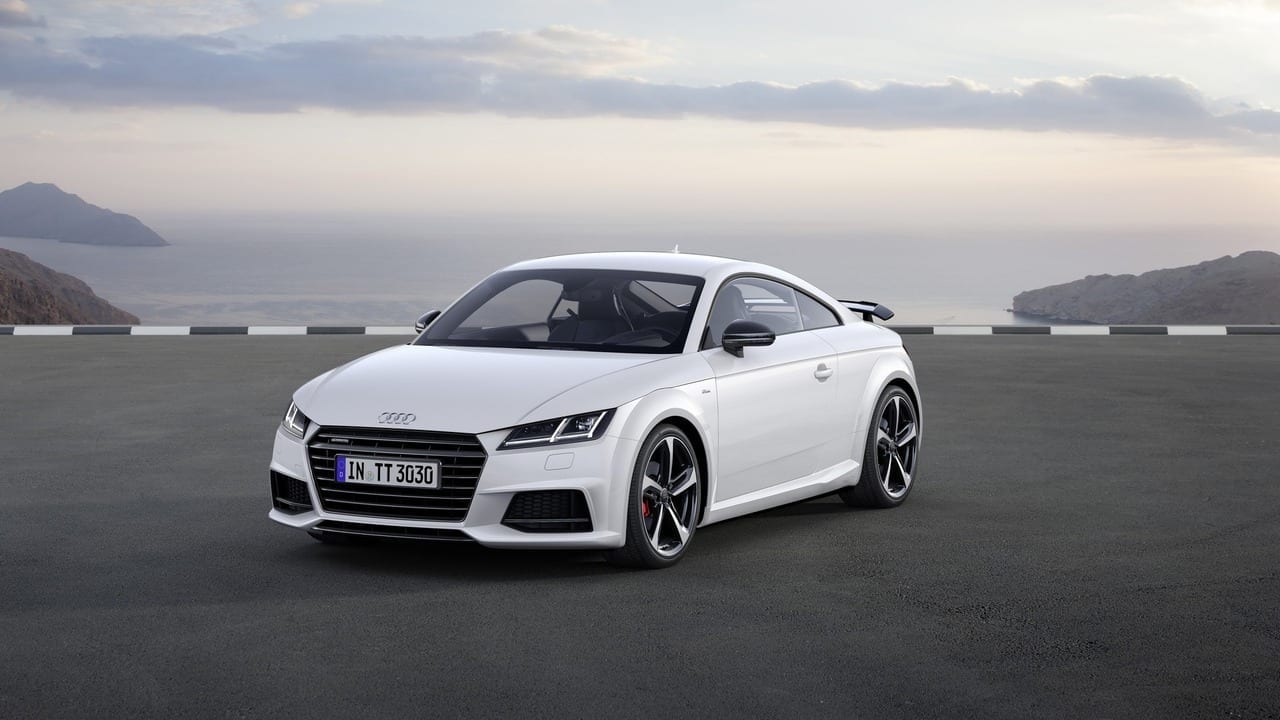
The Audi TT
Below we have the Audi TT sales figures and reporting data for the United States and Canada. The Audi TT is a small 2-door sports car sold in the U.S since the 2000 model year. Initially, the TT featured a 180-hp 1.8-liter turbocharged I-4 mated to five-speed manual transmission and front-drive. The all-new third-generation Audi TT coupe and Audi TT Roadster (debut in 2016) has a turbocharged 2.0-liter TFSI inline-four engine rated 220 hp and 258 lb-ft, while the TTS Coupe model makes 292 hp and 280 lb-ft. We love the Audi TTs Virtual Cockpit with multi-function 12.3-inch display which is definitely class leading.
Audi TT Overview
The Audi TT is a compact sports car produced by the German automaker Audi. It was first introduced in 1998 and quickly gained popularity for its distinctive design, sporty performance, and precise handling. The TT has become one of Audi’s iconic models, known for its unique appearance and fun-to-drive nature. The Audi TT features a striking and iconic design that has evolved over the years while maintaining its distinctive character. The car has a low-slung, coupe-like profile with a prominent curved roofline, giving it a sporty and athletic appearance. The front end is characterized by Audi’s Singleframe grille and signature LED headlights. The TT’s design is often described as timeless and stylish, making it stand out in the sports car segment. For those seeking even higher performance, Audi offers the TT RS, a high-performance variant with more powerful engines, upgraded suspension, and additional performance-oriented features.
Audi TT Sales Data & Trends
The problem with the TT (and this drives the impact on sales figures) is best observed by Motor Trend:
“Though beautifully executed, well-equipped, and generally pleasant to drive, the 2016 Audi TT exists in a curious automotive twilight zone. Audi would like you to think the TT is a Porsche Boxster rival. It isn’t. Competent rather than inspiring, it’s not quite a sports car. And it’s not quite a luxury coupe, either.”
Audi TT US Sales Data & Charts
U.S Monthly Sales
U.S Annual Sales
| Year | Sales Units |
|---|---|
| 2005 | 2,822 |
| 2006 | 954 |
| 2007 | 4,355 |
| 2008 | 4,486 |
| 2009 | 1,935 |
| 2010 | 1,531 |
| 2011 | 2,236 |
| 2012 | 2,226 |
| 2013 | 2,053 |
| 2014 | 1,166 |
| 2015 | 1,167 |
| 2016 | 3,044 |
| 2017 | 2,294 |
| 2018 | 1,289 |
| 2019 | 1,324 |
| 2020 | 832 |
| 2021 | 987 |
| 2022 | 461 |
| 2023 | 725 |
| 2024 | 36 |
U.S Annual Growth
Audi TT Canada Sales Data & Charts
Canada Annual Sales
Year Sales Units
2012
454
2013
370
2014
289
2015
251
2016
579
2017
621
2018
403
2019
348
2020
188
2021
191