The Audi R8
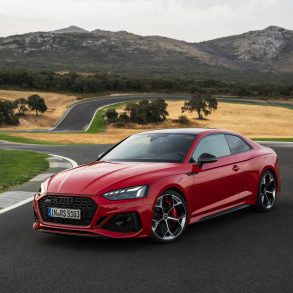
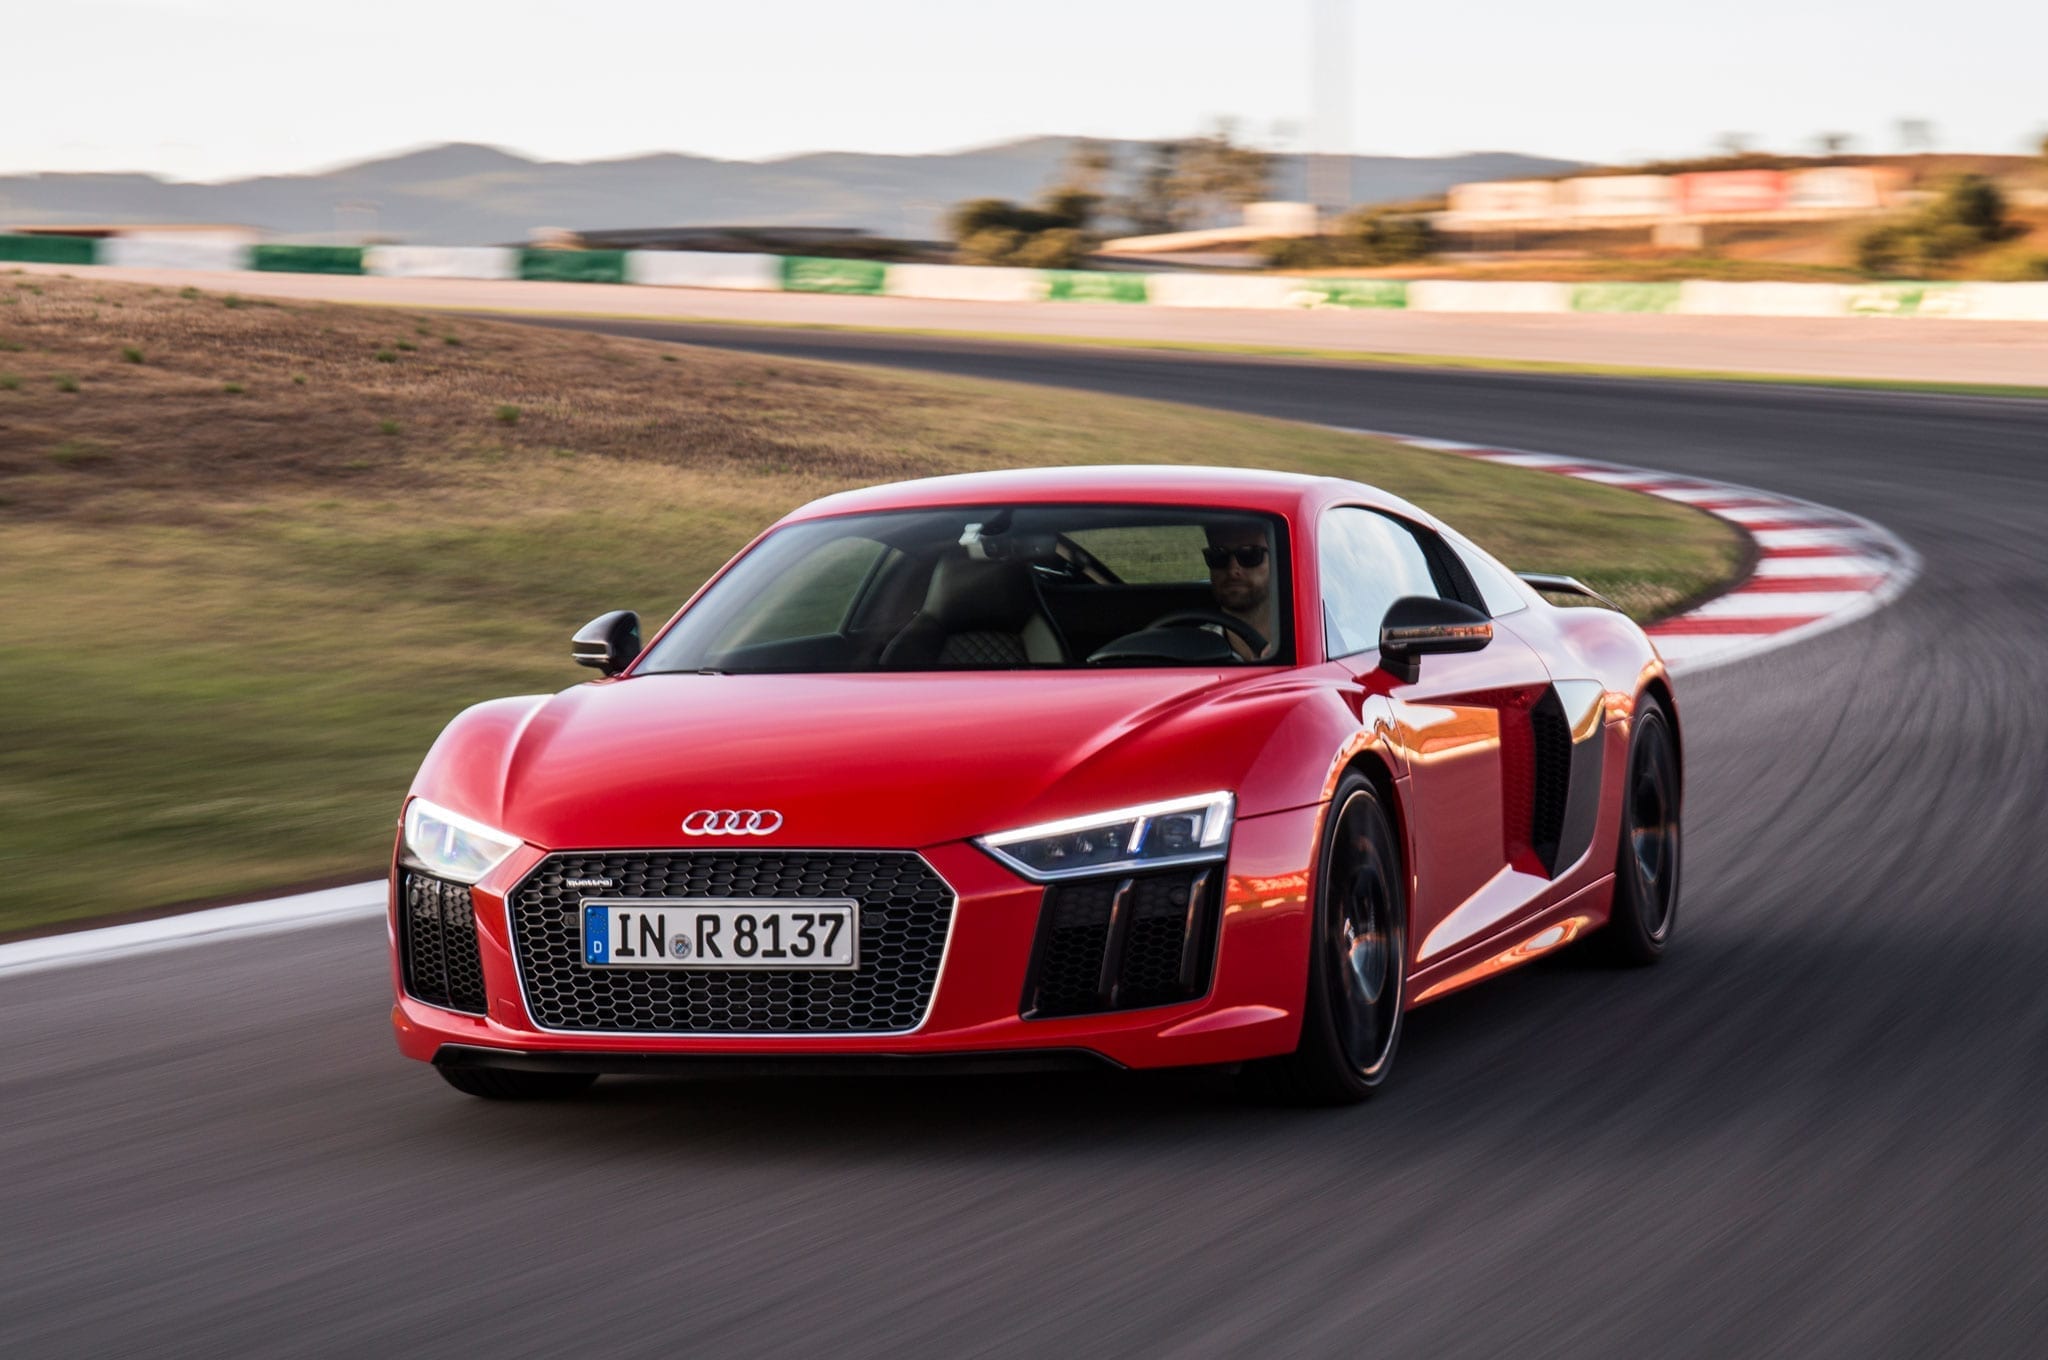
Below we have the Audi R8 sales figures and reporting data for the United States, Europe and Canada. The Audi R8 is a mid-engine, 2-seater sports car that was introduced in 2006. We have been huge fans of the R8 from the beginning. Finally somebody made a sports car that was practical, fun, fast and didn’t have a Porsche nameplate. Despite the amazing car Audi delivered the R8 never sold in Porsche 911 quantities and was relegated to being an also ran in terms of units sold. If you want a fun-to-drive car that you can just enjoy on the open road and drive to the office, you’re looking at the right vehicle and screw what the sales numbers say. Powerful, naturally aspirated engine, perfect handling, all-wheel drive, strong brakes, tech features galore and a design that is still the best, you cannot go wrong.
Audi R8 Overview
The Audi R8 is a high-performance sports car produced by the German automaker Audi. It was first introduced in 2006 and quickly became a flagship model for the brand. The R8 is known for its striking design, impressive performance, and advanced technology, making it one of the most sought-after sports cars in the luxury car market. It is based on the Lamborghini Gallardo platform and is powered by a naturally-aspirated 5.2-liter V10 engine that produces 562 horsepower and 398 pound-feet of torque. The R8 can accelerate from 0 to 60 mph in 3.2 seconds and has a top speed of 201 mph. The R8 is available in both coupe and convertible body styles. The coupe starts at $158,600, and the convertible starts at $164,095.
Audi R8 Sales Data & Trends
As a niche sports car, the Audi R8 never troubled the Porsche 911 in terms of sales volume in any of the core markets, but it elevated the Audi brand and sold well enough to live a long and fruitful life. The Audi R8 is a highly acclaimed sports car that offers a thrilling driving experience, combining power, precision, and luxury. It has been praised by automotive enthusiasts and critics for its performance capabilities and sophisticated design. A commercial success and an iconic car at the same time.
Audi R8 US Sales Data & Charts
U.S Monthly Sales
U.S Annual Sales
| Year | Sales Units |
|---|---|
| 2007 | 241 |
| 2008 | 900 |
| 2009 | 699 |
| 2010 | 799 |
| 2011 | 1,145 |
| 2012 | 802 |
| 2013 | 813 |
| 2014 | 748 |
| 2015 | 495 |
| 2016 | 736 |
| 2017 | 772 |
| 2018 | 927 |
| 2019 | 574 |
| 2020 | 583 |
| 2021 | 648 |
| 2022 | 299 |
| 2023 | 630 |
| 2024 | 182 |
U.S Annual Growth
Audi R8 Canada Sales Data & Charts
Canada Annual Sales
Year Sales Units
2012
112
2013
111
2014
116
2015
89
2016
158
2017
235
2018
231
2019
130
2020
96
2021
147