
The Aston Martin Rapide
The Aston Martin Rapide is a four-door grand tourer that was introduced in 2010. It is the first four-door car produced by Aston Martin since the Lagonda Rapide E which was discontinued in 1990.
Aston Martin Rapide Overview
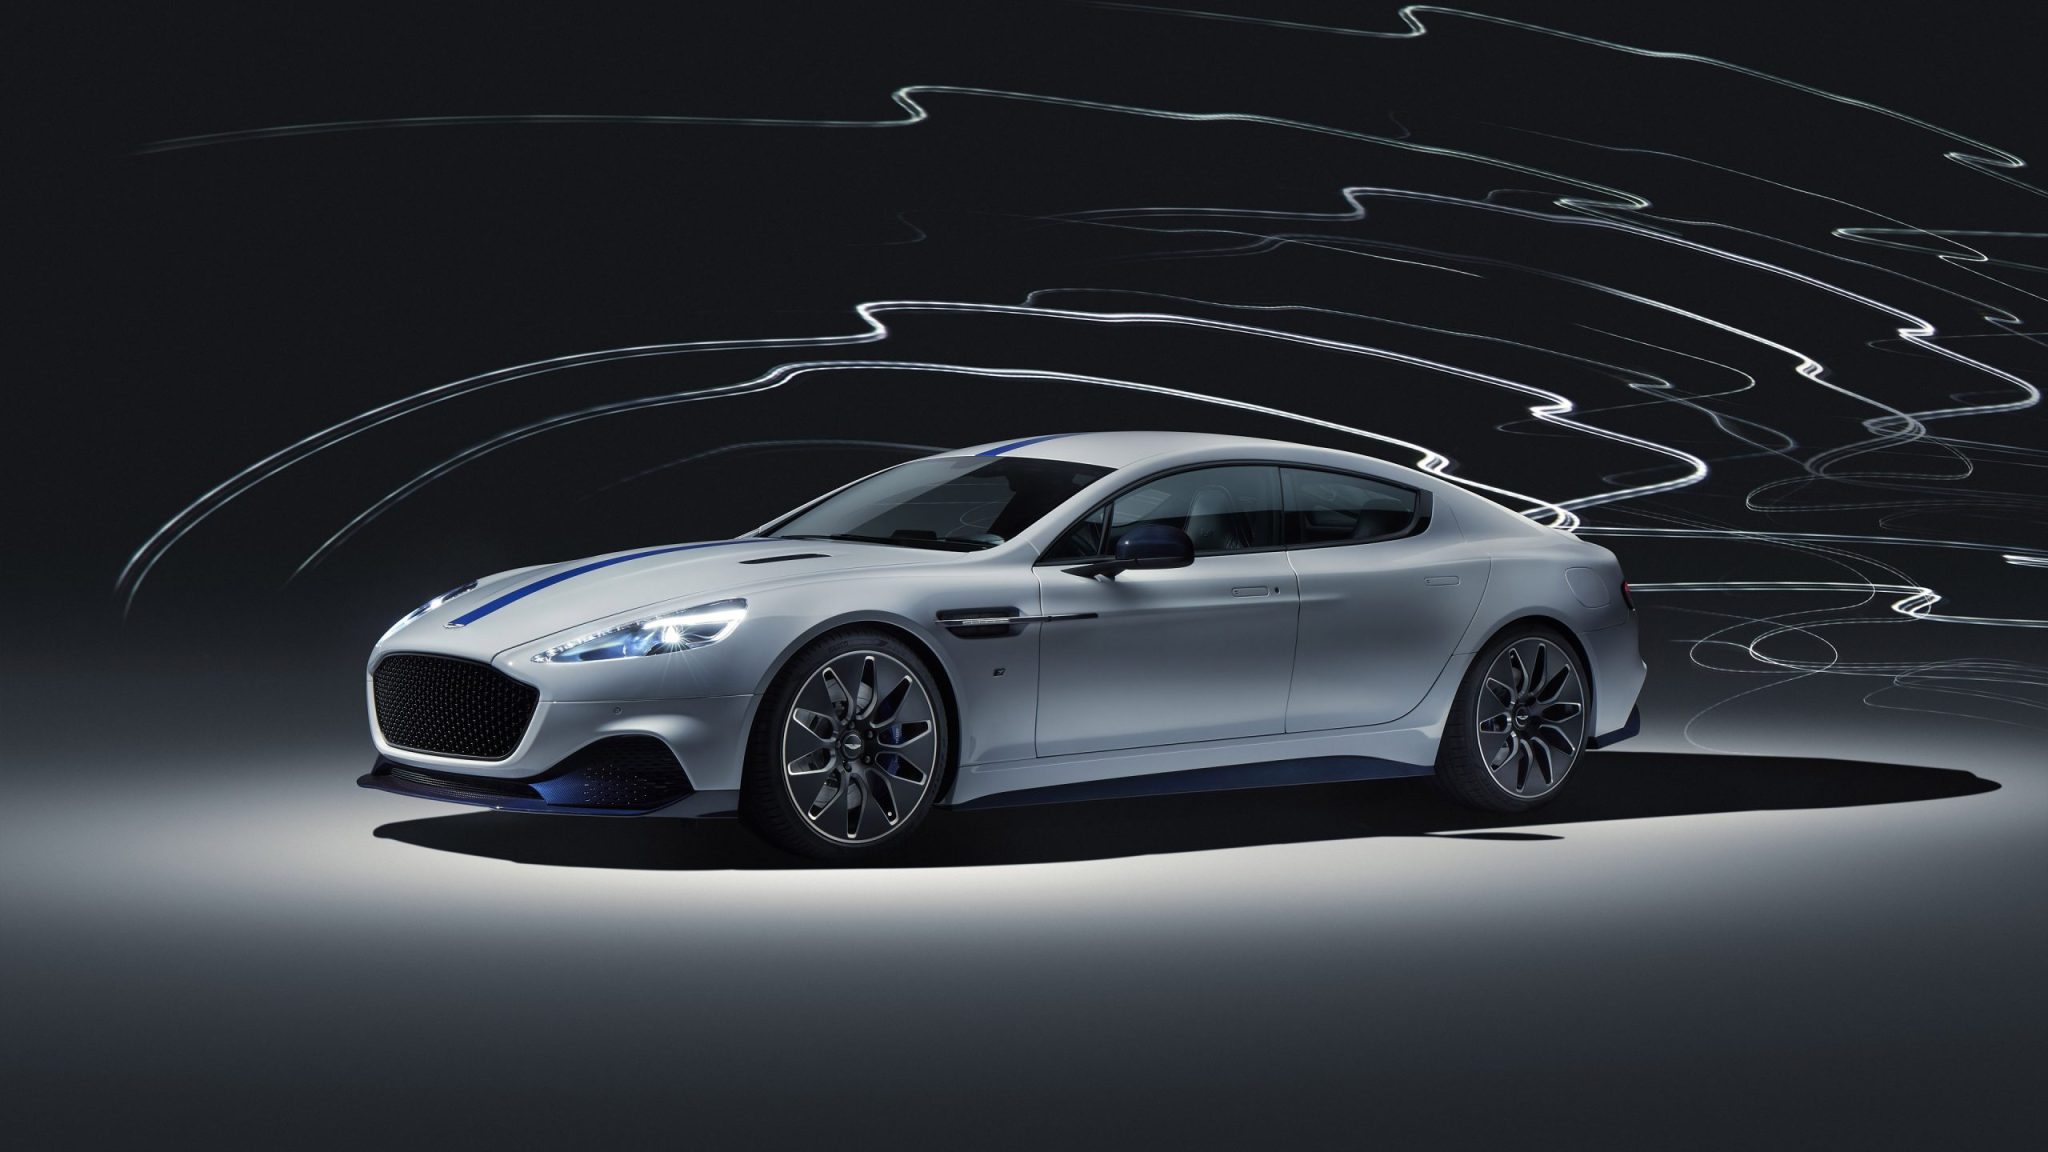
As the marque’s first production four-door sports car, Rapide encapsulates core values of Power, Beauty and Soul; four ‘swan wing’ doors provide access to cosseting sports seats both front and rear bestowing occupants with ample accommodation. A 301 litre luggage compartment affords generous space for belongings for all four passengers whether they be sports bags or indeed, sets of skis, creating an Aston Martin which can be enjoyed on any occasion, anytime, anywhere. Several updates and special editions were created for the Rapide over the years.
The Rapide is powered by a 6.0-liter V12 engine that produces 552 horsepower and 457 pound-feet of torque. It is mated to a six-speed automatic transmission. The Rapide has a top speed of 200 miles per hour and can accelerate from 0 to 60 miles per hour in 4.7 seconds. It is a very luxurious car, with a spacious interior and a long list of standard features. The Rapide’s interior is trimmed in leather and wood, and it features heated and ventilated seats, a panoramic sunroof, and a Bang & Olufsen sound system. The Rapide also comes standard with a number of driver-assistance features, including adaptive cruise control, lane departure warning, and automatic emergency braking. The Aston Martin Rapide is a great choice for a luxurious and powerful four-door car. It is not the most practical car on the market, but it is a great choice for those who are looking for a stylish and high-performance car.
Aston Martin Rapide Sales Data & Trends
Annual sales figures for the Aston Martin Rapide in Europe.
Europe Annual Sales
Europe Annual Growth
Car sales statistics are from the following countries: Austria, Belgium, Cyprus, Czech Republic, Denmark, Estonia, Finland, France, Germany, Great Britain, Greece, Hungary, Iceland, Ireland, Italy, Latvia, Lithuania, Luxembourg, Netherlands, Norway, Poland, Portugal, Romania, Slovakia, Slovenia, Spain, Sweden, Switzerland.
Sources: Manufacturers, ANDC, JATO Dynamics.


