
Wuling Journey
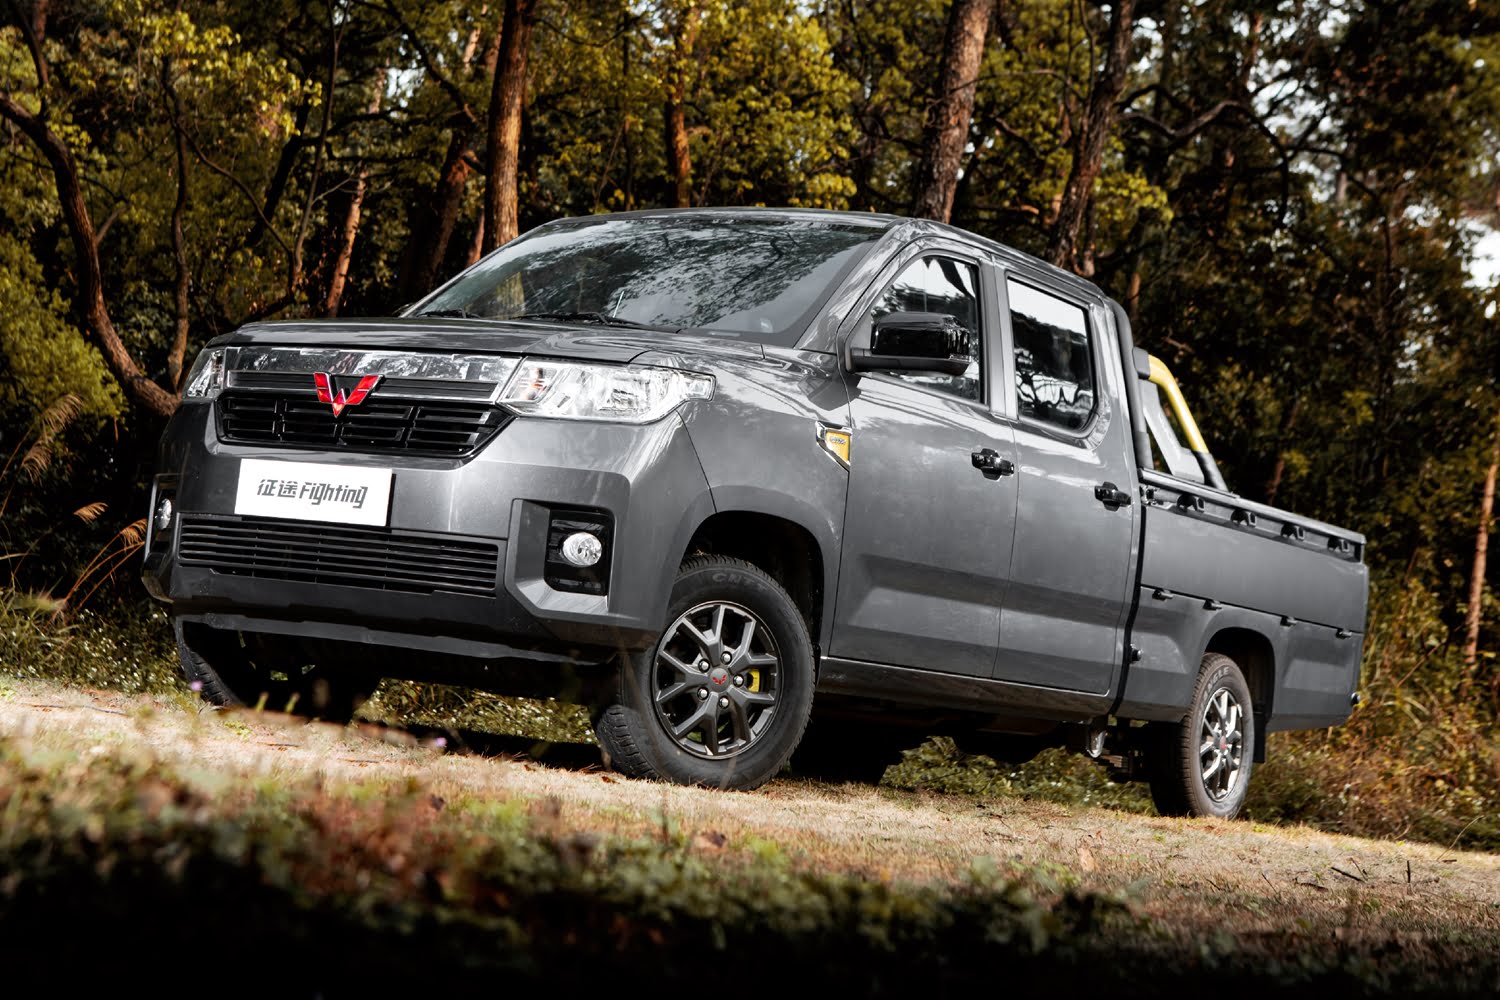
The all-new Wuling Journey opens a new category in China’s growing pickup segment, focusing primarily on meeting the needs and new entrepreneurial spirit of China’s younger customers. With the new Journey, the joint venture hopes to take advantage of high local demand for trucks and further expand Wuling’s sales leadership in the world’s largest automotive market. From a styling standpoint, the Wuling Journey boasts a fairly simplistic design based on the classic “mechanical aesthetics” design language of the portfolio of commercial and private-use models that carry the brand’s original logo. Its double cab bodywork and elongated cargo box are designed to maximize practicality, with simple and ingenious solutions that facilitate daily use as a cargo vehicle.
At launch, the new Journey is available in two variants: Aggressive and Pioneer. Although they have an obvious low-cost approach, both configurations include enough features to meet the expectations of the target customer, including a basic safety equipment package with high-strength steel bodywork, two airbags and anti-lock brakes, as well as an infotainment system with eight-inch touchscreen. Mechanically, the Wuling Journey equips a single powertrain comprised of a naturally aspirated 1.5L engine that produces an output of 98 horsepower and 103 pound-feet of torque, mated to a five-speed manual transmission. In addition, it’s equipped with rear-wheel drive only, while the suspension system uses MacPherson struts up from in combination with rear leaf springs. The all-new Wuling Journey pickup is now available throughout SGMW’s extensive dealer network in China, with a single body configuration and a total of four exterior color combinations with contrasting accents on some parts.


