
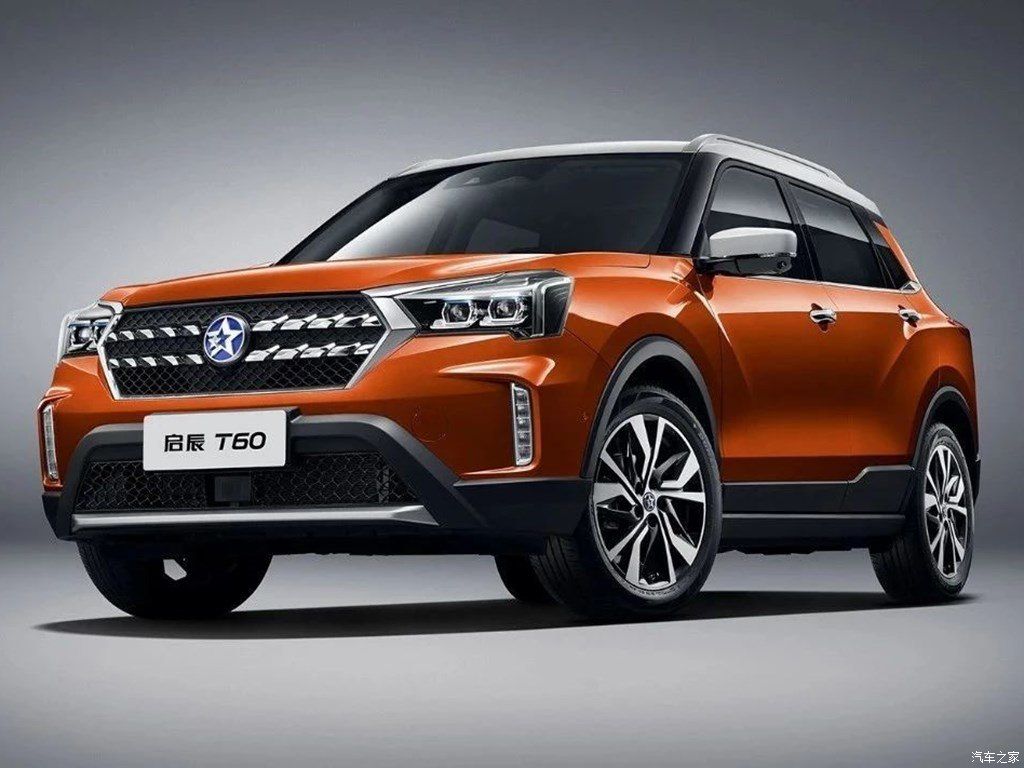
Venucia T60
The Venucia T60 is a subcompact CUV produced by the Chinese car manufacturer Venucia since 2018. The Venucia T60 was launched on to the Chinese auto market during the 2018 Guangzhou Auto Show in November 2018 with a price range from 85,800 yuan to 118,800 yuan. The Venucia T60 is powered by a Nissan-sourced 1.6 liter engine producing 126 hp (93 kW) and 154N·m mated to a CVT.


