Toyota E’Z
The Toyota E’Z was a subcompact car that was produced by Toyota from 2000 to 2017. It was known for its fuel efficiency and affordability. The Echo replaced the Toyota Tercel in 1999 and in its turn it was replaced by the Toyota Yaris in 2006. The E’Z was a popular car in Japan and other Asian markets. It was not sold in the United States.
Toyota E’Z Overview
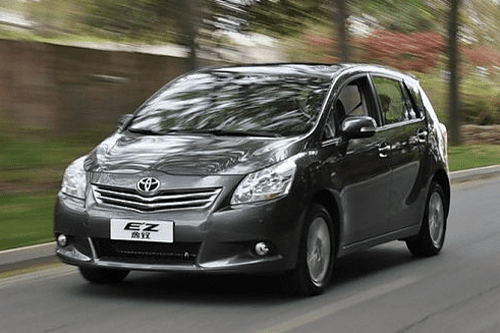
The Toyota E’Z, also known as the Toyota Verso in some markets, is a compact MPV (multi-purpose vehicle) that was introduced by Toyota primarily for the Asian market, specifically in places like Japan and China. While it bears the Verso name in some markets, it’s worth noting that this particular model is distinct from the Verso model sold in European markets.
The vehicle was primarily targeted towards families seeking a spacious and comfortable mode of transportation. The E’Z boasted a roomy interior, which was one of its selling points. The design emphasized comfort and space for passengers. The vehicle typically offered a three-row seating configuration, making it suitable for larger families or those needing extra cargo space. The vehicle’s layout and design placed a significant emphasis on ease of entry and exit, particularly for the rear passengers.
The E’Z typically came equipped with a range of modern features, from infotainment systems to safety technologies. However, the exact features would depend on the trim level and market.
Toyota E’Z Sales Figures
The Toyota E’Z was well-received in its primary target markets, where there’s a strong demand for such practical and spacious vehicles. To sum it up, the Toyota E’Z was a compact MPV designed with family and practicality in mind. Its spacious interior and ease of access made it a favorable choice for families, particularly in urban areas where a combination of space and maneuverability is essential.
Toyota E’Z China Sales Data & Charts
China Annual Sales
| Year | Sales Units |
|---|