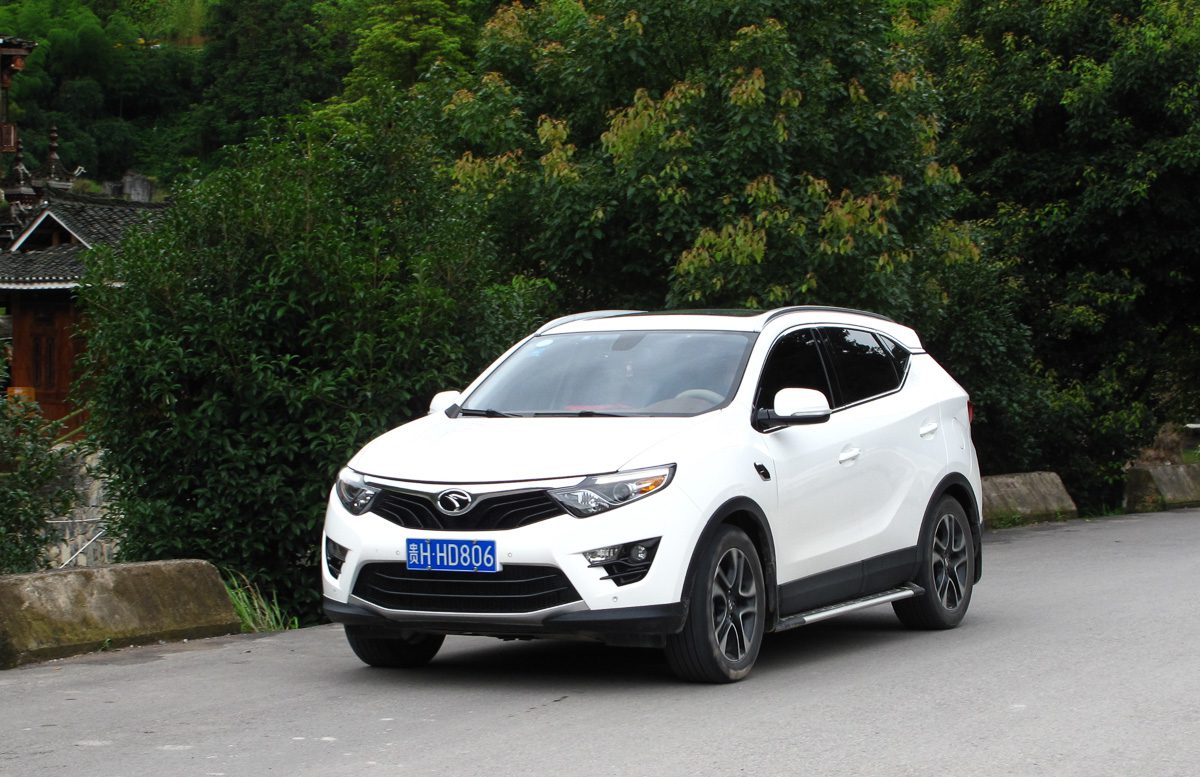
Auto-sales-statistics-China-Soueast_DX7_Bolang-SUVSales figures for the Soueast DX7 Bolang in China.


Car sales statistics from China only include domestic production and exclude imported models.


Soueast
DX7 Bolang
2016
Soueast
DX7 Bolang
2017
Soueast
DX7 Bolang
2018
Soueast
DX7 Bolang
2019
Soueast
DX7 Bolang
2020
Soueast
DX7 Bolang
2021
Soueast
DX7 Bolang
2022
January 9.250 5.049 3.836 398 50 120 31
February 4.301 3.904 1.720 311 2 81 23
March 7.252 2.752 2.046 313 208 109 159
April 5.338 2.959 2.102 241 123 75 10
May 7.087 2.859 1.188 873 142 66 6
June 5.336 2.811 682 842 258 86 26
July 5.392 2.465 877 909 401 68 27
August 6.265 2.831 919 86 172 52 3
September 8.847 3.911 1.431 301 169 81 36
October 9.531 4.088 1.298 172 127 59 33
November 4.173 337 116 129 69
December 7.705 2.784 653 231 302 178

Soueast
DX7 Bolang
2021 1.044
2020 2.083
2019 4.793
2018 17.089
2017 40.586
2016 76.304
2015 29.844


Sources: Manufacturers, Chooseauto.

Soueast
DX7 Bolang
2016
Soueast
DX7 Bolang
2017
Soueast
DX7 Bolang
2018
Soueast
DX7 Bolang
2019
Soueast
DX7 Bolang
2020
Soueast
DX7 Bolang
2021
Soueast
DX7 Bolang
2022
January 9.250 5.049 3.836 398 50 120 31
February 4.301 3.904 1.720 311 2 81 23
March 7.252 2.752 2.046 313 208 109 159
April 5.338 2.959 2.102 241 123 75 10
May 7.087 2.859 1.188 873 142 66 6
June 5.336 2.811 682 842 258 86 26
July 5.392 2.465 877 909 401 68 27
August 6.265 2.831 919 86 172 52 3
September 8.847 3.911 1.431 301 169 81 36
October 9.531 4.088 1.298 172 127 59 33
November 4.173 337 116 129 69
December 7.705 2.784 653 231 302 178

Soueast
DX7 Bolang
2021 1.044
2020 2.083
2019 4.793
2018 17.089
2017 40.586
2016 76.304
2015 29.844