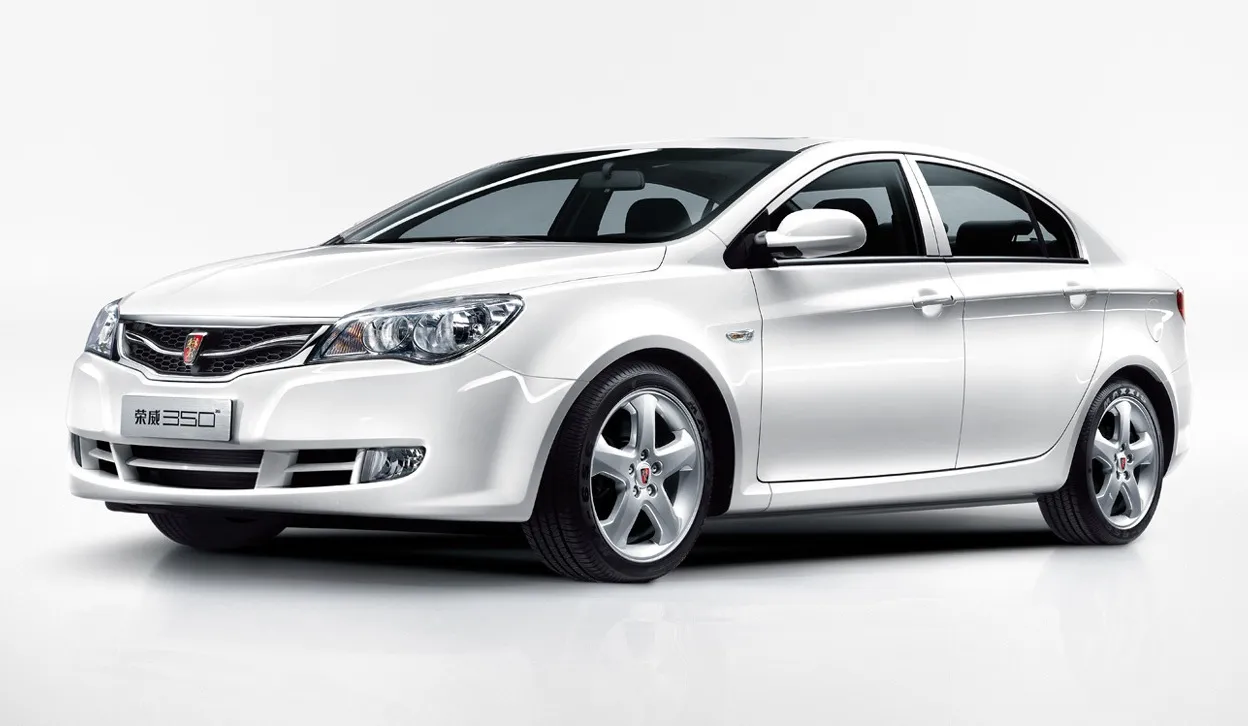
Sales figures for the Roewe 350 in China.
Car sales statistics from China only include domestic production and exclude imported models.
SAIC Roewe3502016 |
SAIC Roewe3502017 |
SAIC Roewe3502018 |
|
January | 4.631 | 2.524 | 1.146 |
February | 3.643 | 2.978 | |
March | 4.993 | 2.085 | |
April | 3.424 | 1.041 | |
May | 3.627 | 1.146 | 2 |
June | 2.786 | 621 | |
July | 3.005 | 958 | |
August | 3.543 | 473 | |
September | 2.700 | 224 | |
October | 3.547 | 266 | |
November | 3.281 | 5 | |
December | 3.403 | 719 |
SAIC Roewe350 |
|
2018 | 1.148 |
2017 | 13.040 |
2016 | 42.583 |
2015 | 52.391 |
2014 | 99.959 |
2013 | 113.033 |
2012 | 74.384 |
2011 | 63.748 |
2010 | 42.437 |
Sources: Manufacturers, Chooseauto.
SAIC Roewe3502016 |
SAIC Roewe3502017 |
SAIC Roewe3502018 |
|
January | 4.631 | 2.524 | 1.146 |
February | 3.643 | 2.978 | |
March | 4.993 | 2.085 | |
April | 3.424 | 1.041 | |
May | 3.627 | 1.146 | 2 |
June | 2.786 | 621 | |
July | 3.005 | 958 | |
August | 3.543 | 473 | |
September | 2.700 | 224 | |
October | 3.547 | 266 | |
November | 3.281 | 5 | |
December | 3.403 | 719 |
SAIC Roewe350 |
|
2018 | 1.148 |
2017 | 13.040 |
2016 | 42.583 |
2015 | 52.391 |
2014 | 99.959 |
2013 | 113.033 |
2012 | 74.384 |
2011 | 63.748 |
2010 | 42.437 |