
Peugeot Sales Data, Trends & Analysis for the Chinese Automotive Market
China auto sales statistics for Peugeot only include the models that are locally produced in China through the Dongfeng-Peugeot-Citroën Automotive Joint Venture with local manufacturing partner Dongfeng Motor, and excludes import models. Also find Peugeot European sales figures. Sales figures for the Peugeot 2008, 3008, 4008, 5008, 301, 307 hatchback, 307 sedan, 308, 308S, 408, 508, 206, 207 and any other car model produced and sold in China since the early 2000’s.
Peugeot China Sales Figures & Recent Highlights
Peugeot, a French automaker with a history spanning over two centuries, has had a significant presence in the Chinese market for many years. The brand’s journey in China has seen many ups and downs, reflecting the complexities and dynamism of the world’s largest auto market. Peugeot’s primary involvement in China has been through its joint venture with Dongfeng Motor Corporation, known as Dongfeng Peugeot-Citroën Automobile (DPCA). Established in the early 1990s, this collaboration allowed Peugeot (and its sister brand, Citroën) to produce and sell vehicles in the Chinese market.
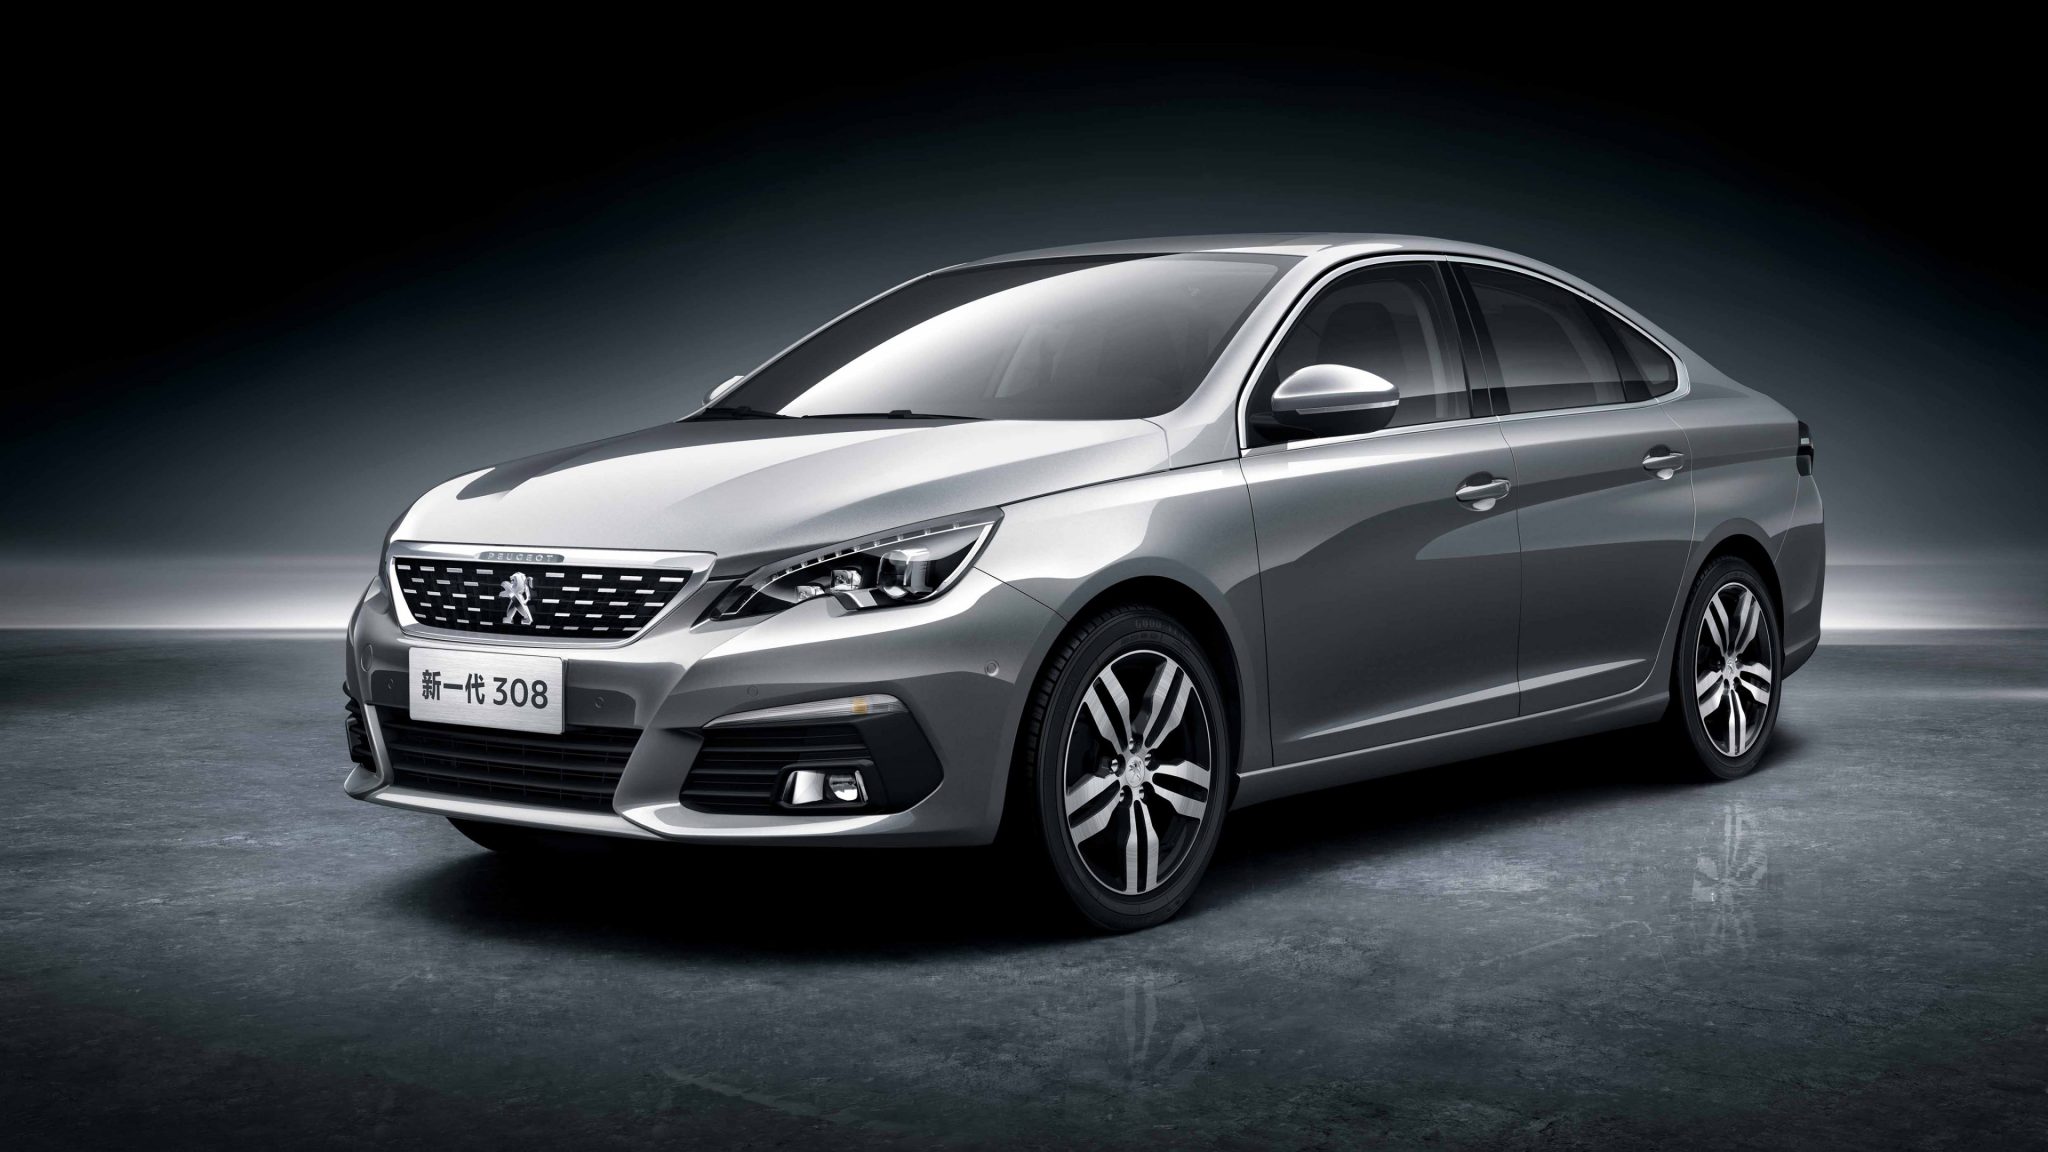
Over the years, Peugeot has offered a range of vehicles in China, from compact cars to sedans and SUVs. Some of these models have been tailored specifically to meet the preferences and demands of Chinese consumers. While Peugeot enjoyed success in the Chinese market during the early and mid-2010s, the brand faced significant challenges towards the end of the decade. Sales numbers dropped substantially, reflecting a combination of factors including increased competition, changing consumer preferences, and broader economic trends. Peugeot, like many traditional automakers, faced stiff competition from emerging domestic brands that offered vehicles with advanced features at competitive prices.
To counter the declining sales, Peugeot embarked on various strategies to revive its brand image and appeal in China. This included launching new models, updating existing ones, and revamping its marketing and dealership strategies. The brand has also been making efforts to tap into the electric vehicle (EV) and hybrid segments, recognizing China’s aggressive push towards green mobility.
In 2020, the parent group of Peugeot, PSA Group, merged with Fiat Chrysler Automobiles (FCA) to form Stellantis, one of the world’s largest auto groups. The merger’s implications for Peugeot’s operations in China remain to be fully seen, but it could provide the brand with more resources and strategic opportunities in the market.
Historically, Peugeot has been perceived as a mid-range brand in China, offering European design and quality. However, with the increased competition and changing market dynamics, the brand has had to continuously adapt to maintain and enhance its positioning.
Peugeot Annual Sales, Growth and Market Share in China
Below we have a table that shows total Peugeot sales volumes for the Chinese automotive market, broken out by year. This data captures all Peugeot vehicle sales for the entire Chinese automotive market.
| Year | Sales | YOY Change | US Marketshare | Marketshare Change |
|---|---|---|---|---|
| 2004 | 11,256 | 0.00 | 0.45 | 0.00 |
| 2005 | 40,388 | 258.81 | 1.27 | 64.86 |
| 2006 | 81,279 | 101.25 | 2.01 | 36.74 |
| 2007 | 92,219 | 13.46 | 1.82 | -10.44 |
| 2008 | 76,375 | -17.18 | 1.45 | -25.27 |
| 2009 | 110,156 | 44.23 | 1.40 | -3.86 |
| 2010 | 149,365 | 35.59 | 1.45 | 3.31 |
| 2011 | 174,137 | 16.58 | 1.56 | 7.24 |
| 2012 | 216,227 | 24.17 | 1.82 | 14.13 |
| 2013 | 272,072 | 25.83 | 1.90 | 4.17 |
| 2014 | 384,005 | 41.14 | 2.37 | 19.95 |
| 2015 | 406,738 | 5.92 | 2.20 | -7.88 |
| 2016 | 349,356 | -14.11 | 1.59 | -38.14 |
| 2017 | 238,624 | -31.70 | 1.04 | -52.96 |
| 2018 | 139,164 | -41.68 | 0.63 | -65.22 |
| 2019 | 63,758 | -54.18 | 0.32 | -99.43 |
| 2020 | 26,626 | -58.24 | 0.14 | -121.41 |
| 2021 | 51,056 | 91.75 | 0.25 | 43.58 |
| 2022 | 57,764 | 13.14 | 0.28 | 9.58 |
Peugeot China Annual Sales Units & Market Share Chart
Below is a visual representation of Peugeot China sales units over time. We have both the Peugeot sales units and the market share in the Chinese market. Click on the items in the legend to see each series by itself.
Peugeot China Growth Rate & Growth Chart
Below is the annual growth rate for the Peugeot brand in China, shown against the Peugeot’s marketshare changes in China. This gives you a good look into how Peugeot has faired against the other brands in terms of absolute sales and effect on marketshare. Click on the items in the legend to see each series by itself.
The Best-Selling Peugeot Cars & SUVs in China
COMING SOON


