
Ora Sales Data, Trends & Analysis for the Chinese Automotive Market
Ora is the newly founded EV-brand from Great Wall Motors which started sales of its all-electric SUVs in 2018. Its first model, the iQ features polarizing and provocative design, completely different from that of the company’s other SUV brands Haval and Wey. Find sales figures for the Ora R1, iQ and any other car model produced and sold in China since the early 2000’s. Car sales statistics from China only include domestic production and exclude imported models.
Ora China Sales Figures & Recent Highlights
Ora is a car brand under Great Wall Motors (GWM), one of China’s largest automotive companies. Established in 2018, Ora focuses specifically on electric vehicles (EVs), reflecting China’s rapid push towards electrification and green mobility. Ora is positioned as an affordable EV brand, aiming to offer electric vehicles that are accessible to a wide range of consumers. The brand targets younger consumers, with design and marketing approaches that emphasize modernity, simplicity, and digital connectivity.
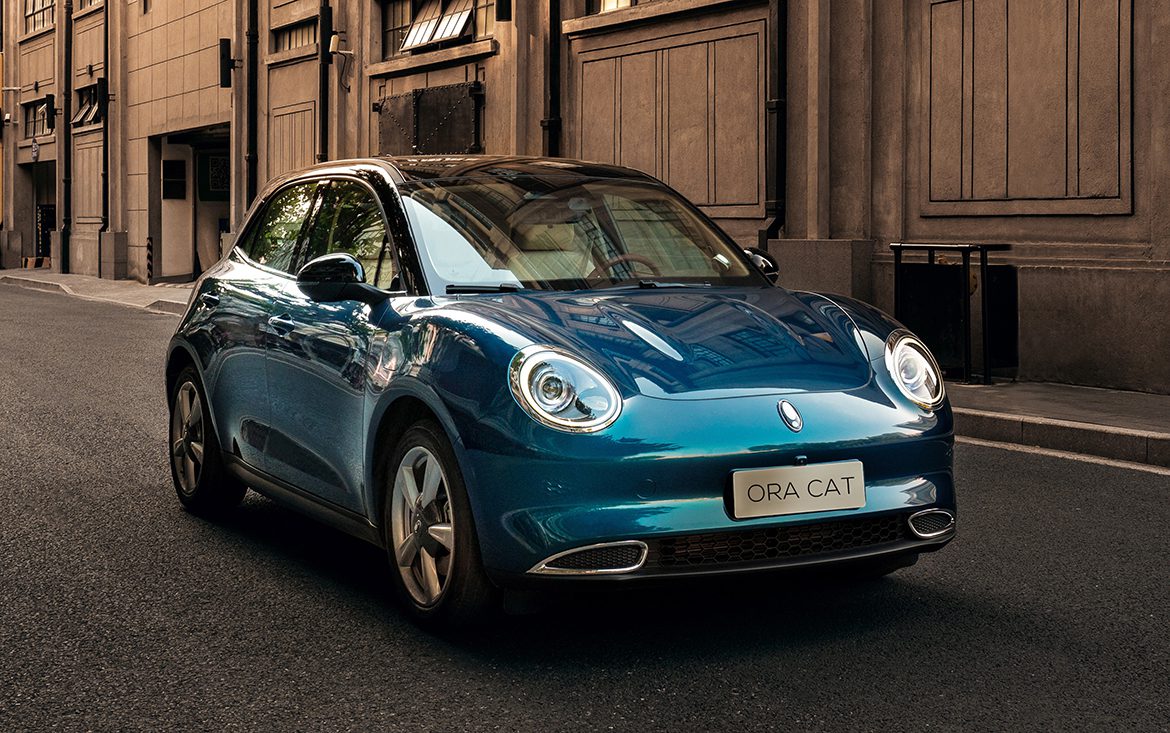
Since its inception, Ora has launched several electric vehicles, each designed to cater to different segments of the market. Models like the Ora R1 and Ora R2 are compact city cars, while there are also larger models that cater to different customer needs. Their cars tend to have quirky and unique designs, distinguishing them from more traditional car designs and appealing to younger audiences.
While Ora focuses on affordability, it doesn’t skimp on technology. Ora vehicles come with a range of modern features like touchscreen interfaces, advanced driver assistance systems, and integrated internet capabilities. The brand emphasizes the range capabilities of its vehicles, aiming to mitigate common range anxieties associated with electric cars.
Ora’s vehicles, especially the compact ones like the Ora R1, have been well-received in the domestic market, particularly due to their competitive pricing and adequate range, making them suitable for urban environments. With the Chinese government offering incentives for EV purchases and prioritizing green mobility solutions, brands like Ora stand to benefit significantly.
Ora Annual Sales Data and Market Share in China
Below we have a table that shows total Ora sales volumes for the Chinese automotive market, broken out by year. This data captures all Ora vehicle sales for the entire Chinese automotive market.
| Year | Sales | YOY Change | US Marketshare | Marketshare Change |
|---|---|---|---|---|
| 2018 | 3,515 | 0.00 | 0.02 | 0.00 |
| 2019 | 38,865 | 1,005.69 | 0.19 | 91.74 |
| 2020 | 56,261 | 44.76 | 0.30 | 36.13 |
| 2021 | 135,028 | 140.00 | 0.67 | 54.92 |
| 2022 | 83,995 | -37.79 | 0.41 | -64.46 |
Ora China Annual Sales Units & Market Share Chart
Below is a visual representation of Ora China sales units over time. We have both the Ora sales units and the market share in the Chinese market. Click on the items in the legend to see each series by itself.
Ora China Growth Rate & Market Share Chart
Below is the annual growth rate for the Ora brand in China, shown against the Ora’s marketshare changes in China. This gives you a good look into how Ora has faired against the other brands in terms of absolute sales and effect on marketshare. Click on the items in the legend to see each series by itself.
The Best-Selling Ora Cars & SUVs in China
COMING SOON


