
Kia K3
The Kia K3 is a compact car produced by the South Korean automaker Kia Motors. It was introduced in 2018 for the Chinese market. The K3 is based on the Kia Forte sedan. The Kia K3 is powered by a 1.4-liter turbocharged four-cylinder engine that produces 138 horsepower and 177 lb-ft of torque. It is available with either a manual or automatic transmission.
The Kia K3 is available in both sedan and hatchback body styles. It has a spacious interior for a compact car. It has 13.2 cubic feet of cargo space behind the rear seats and 41.0 cubic feet with the rear seats folded down. The K3 also has a number of features that make it comfortable, such as air conditioning, power windows and locks, and a 6.5-inch touchscreen infotainment system.
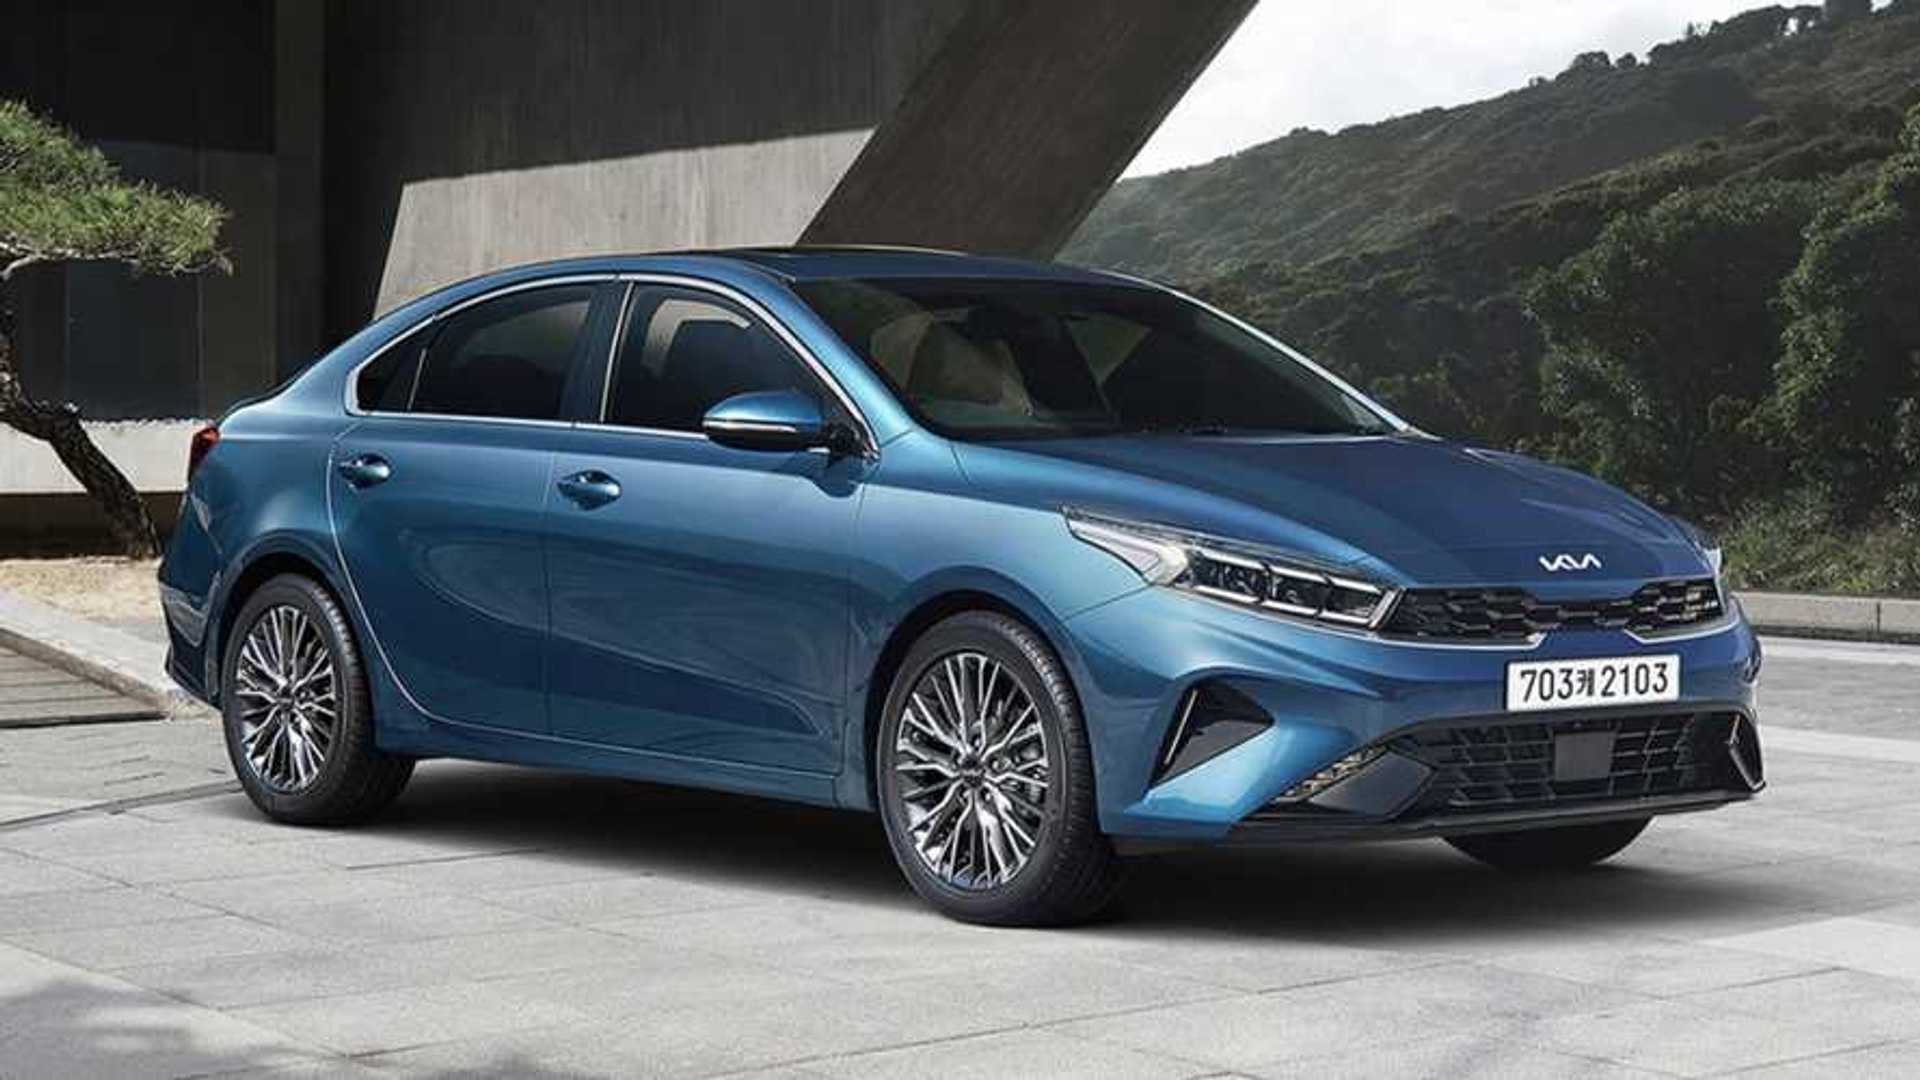
The Kia K3 is a good value for money car that offers a lot of features and amenities. It is also a fun car to drive and has a spacious interior. The refreshed 2022 Kia K3/Forte benefits from attractive new headlights, slightly different taillights, and a new wheel design.
Kia K3 China Sales Data & Charts
The Kia K3 is a popular car in China. It is a good value for money car that offers a lot of features and amenities. It is also a fun car to drive and has a spacious interior.
| Year | Sales Units |
|---|---|
| 2012 | 26,849 |
| 2013 | 135,666 |
| 2014 | 174,119 |
| 2015 | 156,033 |
| 2016 | 193,408 |
| 2017 | 139,107 |
| 2018 | 77,920 |
| 2019 | 38,827 |
| 2020 | 28,753 |
| 2021 | 19,925 |
| 2022 | 13,799 |


