
Karry Sales Data, Trends & Analysis for the China Automotive Market
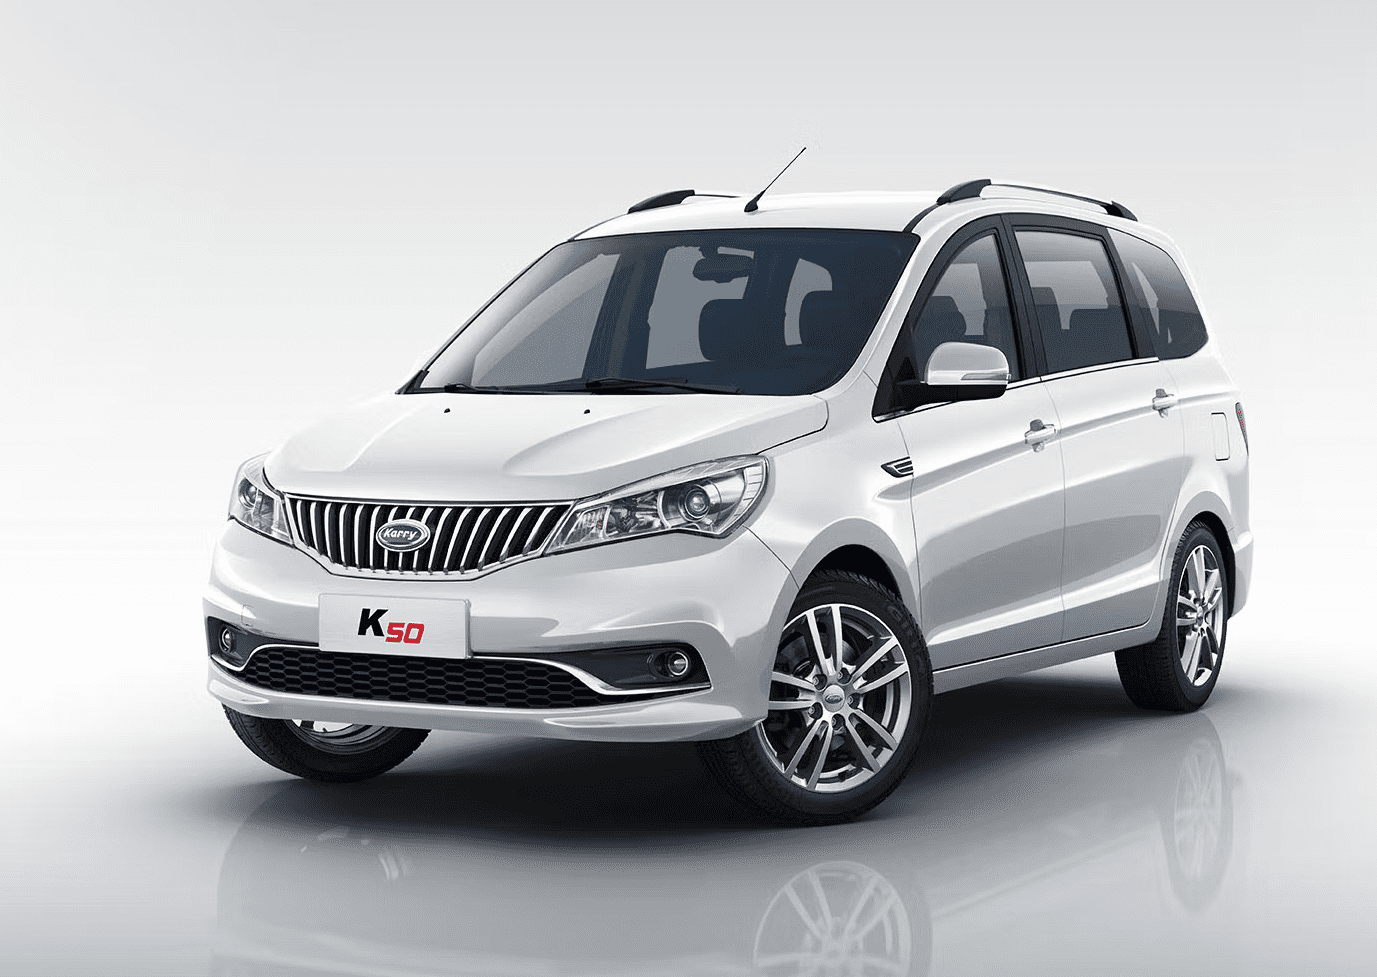
Karry is a minivan and commercial vehicle brand created in 2007 by Chery Auto, which also produces and markets cars under the Chery, Rely and Riich (sub-)brands in China and has manufacturing Joint Ventures with Suzuki, Land Rover. Find sales figures for the Karry K50, K60, Youya S22, Yousheng Q21, Youyi A18, Youyou Q22 and any other car model produced and sold in China since the early 2000’s. Car sales statistics from China only include domestic production and exclude imported models. Karry cars are known for their affordability, durability, and practicality. The brand’s most popular models in China include the Karry K5 and Karry K60, both minivans, and the Karry Youya, a light commercial vehicle.
Karry China Sales Figures & Recent Highlights
Karry (Chinese: 开瑞; pinyin: Kāir瑞) is a Chinese automobile marque owned by Chery Automobile Co., Ltd., a state-owned automobile manufacturer headquartered in Wuhu, Anhui, China. Karry was founded in 2009 and specializes in the production of light commercial vehicles and people carriers for passenger transport. It is a subsidiary of Chery Commercial Vehicle (Anhui) Co. Ltd. and is based in Anhui, Wuhu in China.
Chery Automobile, which was founded in 1997 and is based in Wuhu, Anhui Province, established the Karry brand to cater to the commercial vehicle segment of the Chinese market. Chery itself is better known for its passenger vehicles, but as the company grew, it diversified its portfolio to tap into the lucrative LCV market, leading to the creation of Karry.
Karry’s lineup mainly consists of light trucks, vans, and minibuses. These vehicles are designed to cater to the varied needs of businesses in China, from small enterprises to larger logistic operations. The brand’s vehicles are recognized for their affordability and practicality. Karry, being a subsidiary of Chery, benefits from the parent company’s vast distribution network and after-sales service infrastructure.
The brand has made efforts to penetrate not just urban markets but also rural areas of China, where there’s a demand for reliable and cost-effective commercial vehicles. The commercial vehicle segment in China is highly competitive, with both domestic and international brands vying for market share. Karry faces competition from brands like Wuling, Foton, and JAC, among others.
Continuous innovation, quality improvement, and adapting to changing market dynamics are crucial for Karry to maintain and enhance its position in the market. Leveraging Chery’s global reach, Karry has explored opportunities in international markets, particularly in developing countries where there’s demand for affordable and durable commercial vehicles.
Karry Annual Sales, Growth and Market Share in China
Below we have a table that shows total Karry sales volumes for the Chinese automotive market, broken out by year. This data captures all Karry vehicle sales for the entire Chinese automotive market.
| Year | Sales | YOY Change | Marketshare | Marketshare Change |
|---|---|---|---|---|
| 2007 | 1,818 | 0.00 | 0.04 | 0.00 |
| 2008 | 1,907 | 4.90 | 0.04 | 1.10 |
| 2009 | 11,183 | 486.42 | 0.14 | 74.45 |
| 2010 | 20,096 | 79.70 | 0.19 | 27.04 |
| 2011 | 44,024 | 119.07 | 0.39 | 50.63 |
| 2012 | 25,810 | -41.37 | 0.22 | -81.88 |
| 2013 | 6,900 | -73.27 | 0.05 | -351.05 |
| 2014 | 5,104 | -26.03 | 0.03 | -52.74 |
| 2015 | 50,104 | 881.66 | 0.27 | 88.36 |
| 2016 | 72,830 | 45.36 | 0.33 | 18.37 |
| 2017 | 90,762 | 24.62 | 0.40 | 16.16 |
| 2018 | 48,257 | -46.83 | 0.22 | -81.23 |
| 2019 | 10,217 | -78.83 | 0.05 | -331.56 |
| 2020 | 1,591 | -84.43 | 0.01 | -493.78 |
| 2021 | 2,587 | 62.60 | 0.01 | 33.46 |
| 2022 | 1,488 | -42.48 | 0.01 | -77.86 |
Karry China Annual Sales Units & Market Share Chart
Below is a visual representation of Karry China sales units over time. We have both the Karry sales units and the market share in the Chinese market. Click on the items in the legend to see each series by itself.
Karry China Growth Rate & Market Share Chart
Below is the annual growth rate for the Karry brand in China, shown against the Karry’s marketshare changes in China. This gives you a good look into how Karry has faired against the other brands in terms of absolute sales and effect on marketshare. Click on the items in the legend to see each series by itself.
The Best-Selling Karry Cars & SUVs in China
COMING SOON
Sources: Manufacturers, ANDC, JATO Dynamics.


