
Jinbei Sales Data, Trends & Analysis for the China Automotive Market
Jinbei is a brand of Renault Brilliance Jinbei Automotive Co., Ltd., a joint venture between Brilliance Auto (51%) and Renault (49%) established in December 2017 and based in Shenyang, Liaoning, China. Until 2017, Jinbei was owned by Shenyang Brilliance Jinbei Automotive, a Brilliance subsidiary also based in Shenyang. Brilliance Auto, established in 2003, produces and markets cars under the Brilliance, Huasong and Jinbei (sub-)brands in China and also has a manufacturing Joint Venture with BMW. Also find sales figures for the Jinbei Guanjing, Grace, 750, F50, S50. Car sales statistics from China only include domestic production and exclude imported models.
Jinbei China Sales Figures & Recent Highlights
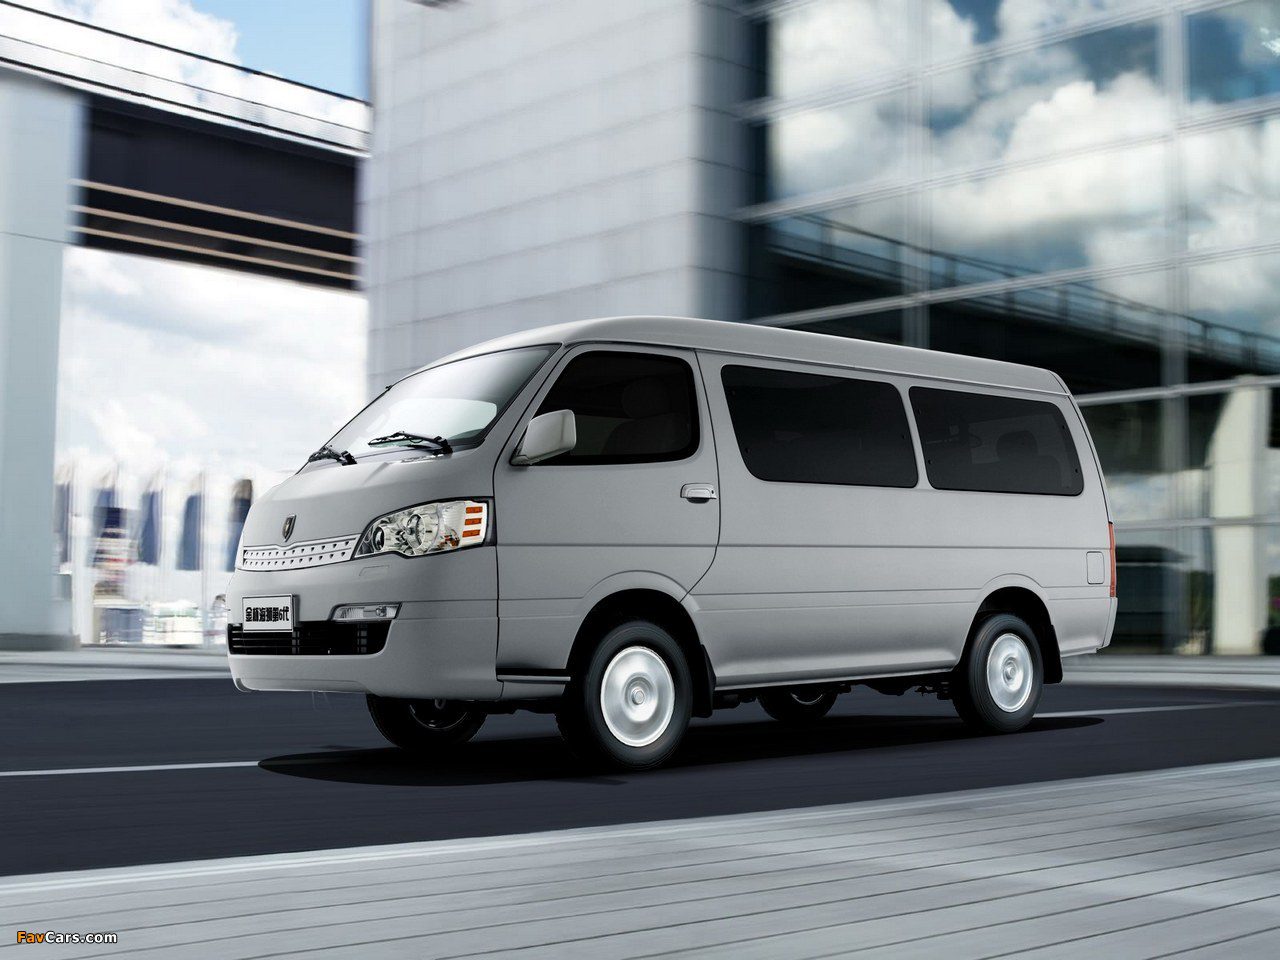
Jinbei was founded in 1989 as a joint venture between Brilliance Auto and Toyota. The company’s first vehicle was the Jinbei Haise, a licensed version of the Toyota Hiace. Jinbei has since expanded its product lineup to include a wide range of vehicles, including sedans, SUVs, MPVs, and commercial vehicles.
The brand’s most notable model is the Jiangnan TT, which became known for its striking resemblance to the Suzuki Alto. The TT became famous for being one of the cheapest cars available in China. Despite its low price, the Jiangnan TT was equipped with basic features and was primarily targeted at consumers in smaller cities and rural areas where there was demand for affordable transportation.
In 2009, Jiangnan Auto was acquired by Zotye Automobile, another Chinese automaker. After the acquisition, Zotye continued the production of the Jiangnan TT for some time but later shifted its focus to other models under the Zotye brand. Zotye’s acquisition allowed the company to leverage Jiangnan’s manufacturing capabilities and expand its product lineup.
While the Jiangnan TT’s low price was its main selling point, the car faced challenges in terms of perceived quality and safety, especially when compared to slightly more expensive competitors that offered better features and reliability. As the Chinese auto market evolved and consumers’ expectations grew, ultra-cheap vehicles like the Jiangnan TT struggled to maintain their appeal. Additionally, rising competition from other low-cost domestic brands further squeezed Jiangnan’s market position.
Jinbei Annual Sales, Growth and Market Share in China
Below we have a table that shows total Jinbei sales volumes for the Chinese automotive market, broken out by year. This data captures all Jinbei vehicle sales for the entire Chinese automotive market.
| Year | Sales | YOY Change | Marketshare | Marketshare Change |
|---|---|---|---|---|
| 2003 | 118 | 0.00 | 0.01 | 0.00 |
| 2004 | 850 | 620.34 | 0.03 | 84.41 |
| 2005 | 5,053 | 494.47 | 0.16 | 78.79 |
| 2006 | 10,060 | 99.09 | 0.25 | 36.06 |
| 2007 | 11,900 | 18.29 | 0.24 | -5.93 |
| 2008 | 12,108 | 1.75 | 0.23 | -1.96 |
| 2009 | 13,864 | 14.50 | 0.18 | -30.83 |
| 2010 | 18,113 | 30.65 | 0.18 | -0.35 |
| 2011 | 18,269 | 0.86 | 0.16 | -7.22 |
| 2012 | 16,814 | -7.96 | 0.14 | -15.86 |
| 2013 | 18,579 | 10.50 | 0.13 | -9.13 |
| 2014 | 15,729 | -15.34 | 0.10 | -33.45 |
| 2015 | 32,244 | 105.00 | 0.17 | 44.26 |
| 2016 | 71,399 | 121.43 | 0.33 | 46.42 |
| 2017 | 49,282 | -30.98 | 0.21 | -51.37 |
| 2018 | 19,106 | -61.23 | 0.09 | -148.54 |
| 2019 | 24,437 | 27.90 | 0.12 | 28.56 |
| 2020 | 17,204 | -29.60 | 0.09 | -31.34 |
| 2021 | 7,042 | -59.07 | 0.03 | -164.32 |
| 2022 | 0 | -100.00 | 0.00 | 0.00 |
Jinbei China Annual Sales Units & Growth Chart
Below is a visual representation of Jinbei China sales units over time. We have both the JMC sales units and the market share in the Chinese market. Click on the items in the legend to see each series by itself.
Jinbei China Growth Rate & Market Share Chart
Below is the annual growth rate for the Jinbei brand in China, shown against the Jinbei’s marketshare changes in China. This gives you a good look into how Jinbei has faired against the other brands in terms of absolute sales and effect on marketshare. Click on the items in the legend to see each series by itself.
The Best-Selling Jinbei Cars & SUVs in China
Coming Soon
Sources: Manufacturers, ANDC, JATO Dynamics.


