
Hyundai Mistra
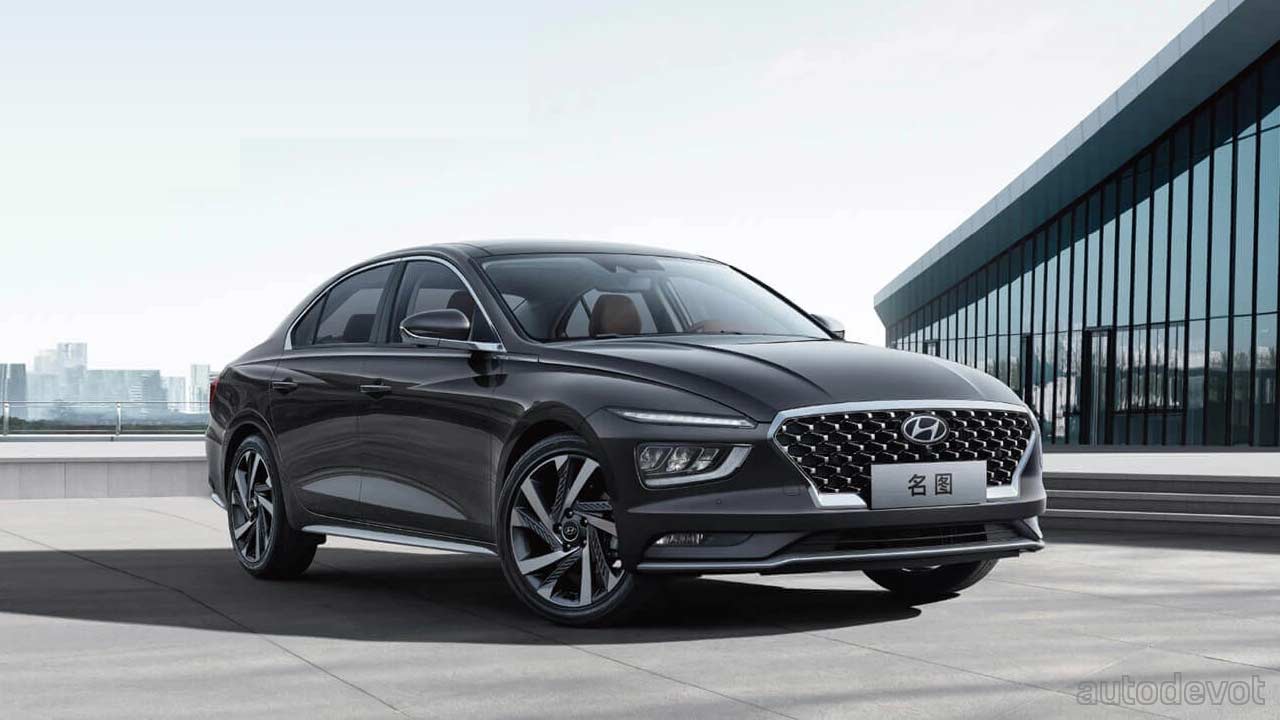
The Hyundai Mistra is a mid-size sedan produced by Beijing Hyundai, a joint venture between Hyundai Motor Company and BAIC Motor. The Mistra was specifically designed for the Chinese market, where it was first introduced in 2013. The Mistra’s design is intended to appeal to the tastes of the Chinese market, reflecting a blend of elegance and sportiness. Over the years, it has seen several updates and facelifts, maintaining its modern aesthetic with sleek lines, LED lighting, and a prominent front grille.
The Mistra has been available with various engine options, including a 1.6-liter turbocharged engine and a 1.8-liter naturally aspirated engine. In later models, a hybrid version was also introduced, aligning with the growing interest in electrified vehicles in China. In addition to the conventional gasoline and hybrid versions, an electric variant of the Mistra was also introduced. The Hyundai Mistra EV caters to the growing demand for electric mobility in China and features a fully electric powertrain with a competitive range.
Hyundai Mistra China Sales Data & Charts
| Year | Sales Units |
|---|---|
| 2013 | 16,762 |
| 2014 | 134,997 |
| 2015 | 154,603 |
| 2016 | 148,254 |
| 2017 | 134,664 |
| 2018 | 99,118 |
| 2019 | 42,509 |
| 2020 | 21,649 |
| 2021 | 5,821 |
| 2022 | 617 |


