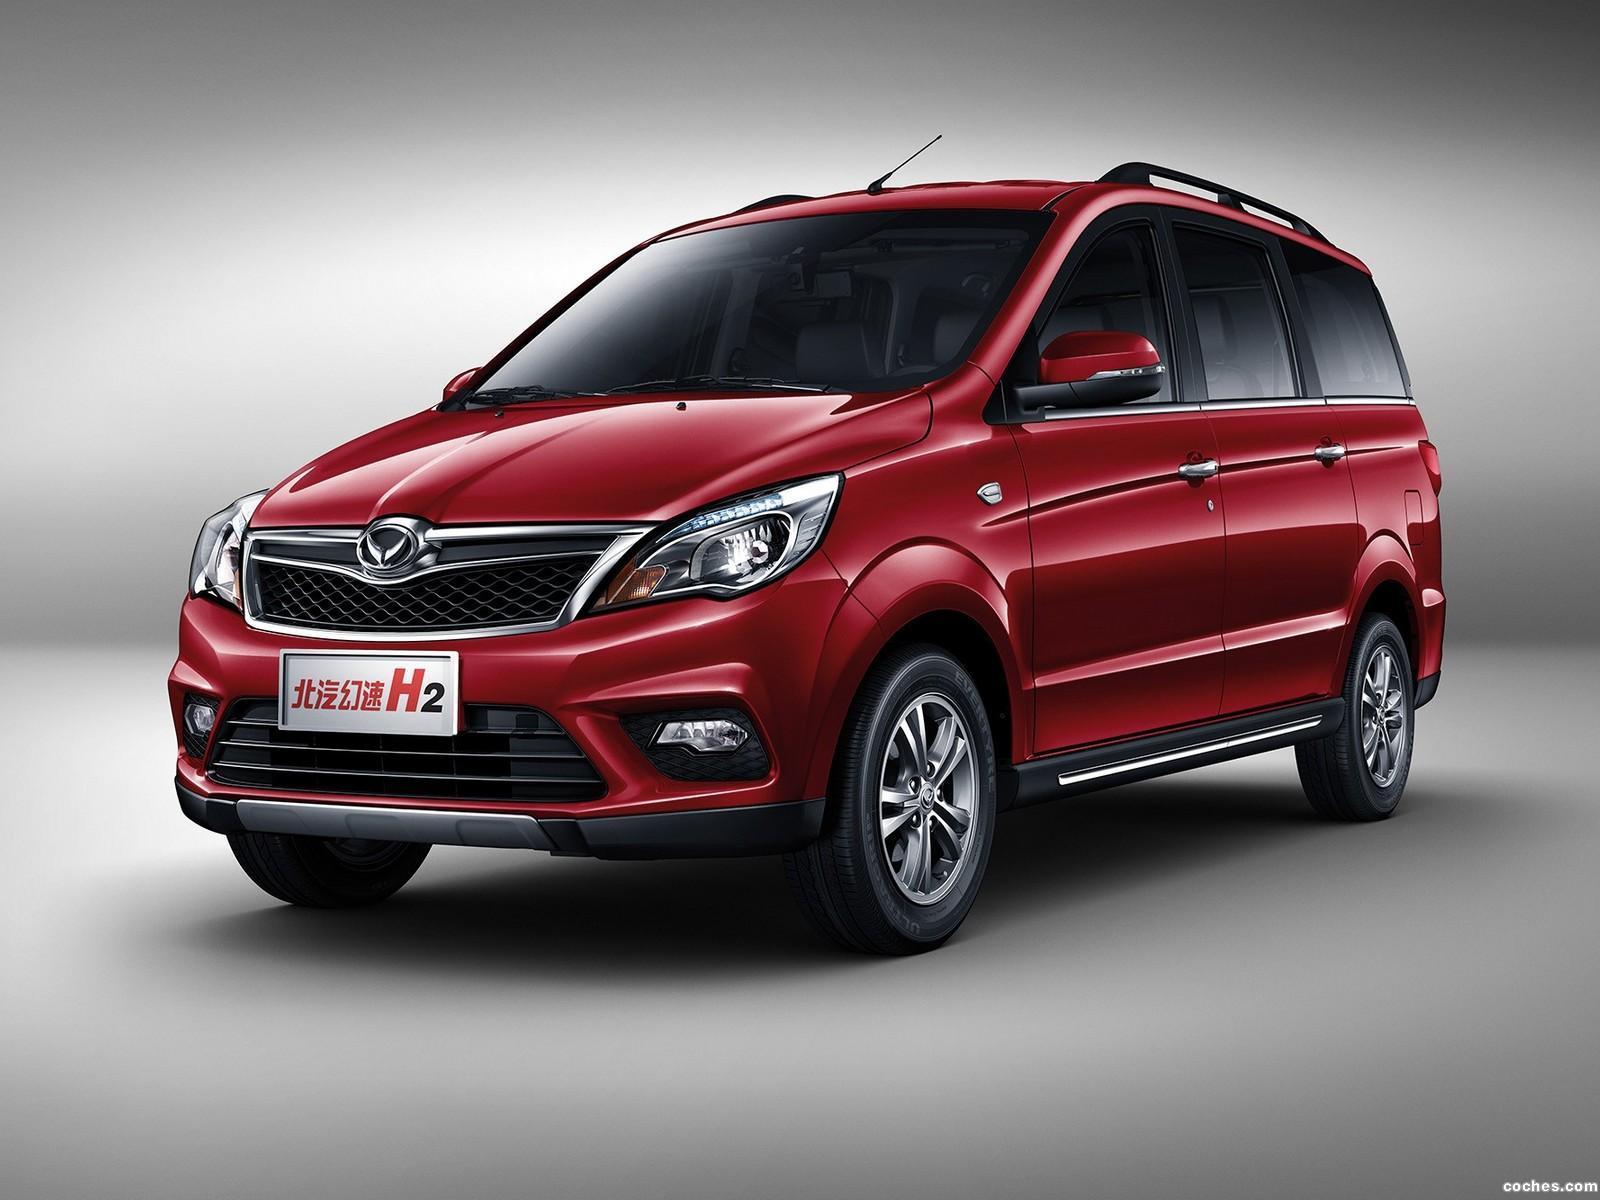
Sales figures for the BAIC Beijing Huansu H2 in China.
Car sales statistics from China only include domestic production and exclude imported models.
HuansuH22016 |
HuansuH22017 |
HuansuH22018 |
HuansuH22019 |
HuansuH22020 |
HuansuH22021 |
|
January | 2.184 | 1.723 | 2.682 | 458 | ||
February | 211 | 1.269 | 1.084 | 663 | ||
March | 1.683 | 2.253 | 984 | 1.667 | ||
April | 1.523 | 1.355 | 582 | 145 | ||
May | 1.533 | 788 | 512 | 161 | ||
June | 568 | 1.286 | 401 | 81 | 8 | |
July | 403 | 1.056 | 84 | 112 | 4 | |
August | 578 | 1.241 | 40 | 33 | 2 | |
September | 589 | 2.634 | 10 | 33 | ||
October | 1.103 | 3.078 | 15 | 36 | 69 | |
November | 1.115 | 5.339 | 10 | 21 | ||
December | 2.565 | 7.263 | 531 | 33 |
HuansuH2 |
|
2021 | 8 |
2020 | 75 |
2019 | 3.443 |
2018 | 6.935 |
2017 | 29.285 |
2016 | 14.055 |
2015 | 18.818 |
Sources: Manufacturers, Chooseauto.
HuansuH22016 |
HuansuH22017 |
HuansuH22018 |
HuansuH22019 |
HuansuH22020 |
HuansuH22021 |
|
January | 2.184 | 1.723 | 2.682 | 458 | ||
February | 211 | 1.269 | 1.084 | 663 | ||
March | 1.683 | 2.253 | 984 | 1.667 | ||
April | 1.523 | 1.355 | 582 | 145 | ||
May | 1.533 | 788 | 512 | 161 | ||
June | 568 | 1.286 | 401 | 81 | 8 | |
July | 403 | 1.056 | 84 | 112 | 4 | |
August | 578 | 1.241 | 40 | 33 | 2 | |
September | 589 | 2.634 | 10 | 33 | ||
October | 1.103 | 3.078 | 15 | 36 | 69 | |
November | 1.115 | 5.339 | 10 | 21 | ||
December | 2.565 | 7.263 | 531 | 33 |
HuansuH2 |
|
2021 | 8 |
2020 | 75 |
2019 | 3.443 |
2018 | 6.935 |
2017 | 29.285 |
2016 | 14.055 |
2015 | 18.818 |