
Honda City
At the end of 2015, the Honda Greiz was launched as a sportier looking version of the City. The City is produced by the Guangzhou-Honda Joint Venture, while the Greiz is made by the Dongfeng-Honda Joint Venture. As Honda has two JV’s in China, each wants a similar successful model as the other, which leads to two versions of a single model being offered in China, just like the Vezel and XR-V.
Honda City Overview
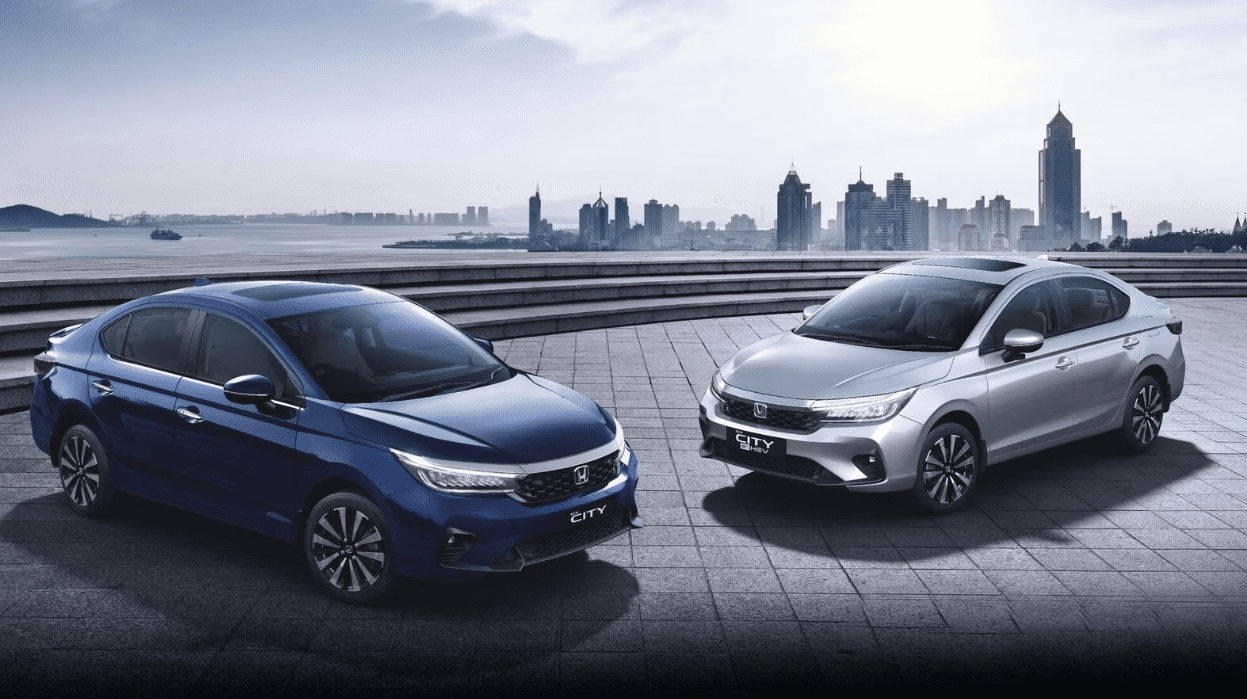
The Honda City is a subcompact car that is currently in its fifth generation. It is sold in Asia, Africa, Europe, and Latin America. The City is known for its fuel efficiency, spacious interior, and comfortable ride. The current-generation City is available with a 1.5-liter four-cylinder engine that produces 119 horsepower and 107 lb-ft of torque. It is mated to a CVT (continuously variable transmission). The City is available in both gasoline and hybrid variants. The hybrid variant uses a 1.5-liter Atkinson-cycle four-cylinder engine and an electric motor that together produce 127 horsepower and 127 lb-ft of torque.
The City is available in a variety of trim levels, including the base S, the mid-level SV, and the top-of-the-line RS. The S trim comes standard with features such as a 6.8-inch touchscreen infotainment system, a rearview camera, and Bluetooth connectivity. The SV trim adds features such as a sunroof, alloy wheels, and fog lights. The RS trim adds features such as a sport-tuned suspension, a body kit, and alloy wheels.
Honda City Sales Data & Charts
China Annual Sales
| Year | Sales Units |
|---|---|
| 2006 | 41,903 |
| 2007 | 68,129 |
| 2008 | 56,938 |
| 2009 | 113,230 |
| 2010 | 132,635 |
| 2011 | 123,502 |
| 2012 | 96,913 |
| 2013 | 95,313 |
| 2014 | 45,393 |
| 2015 | 50,304 |
| 2016 | 70,837 |
| 2017 | 63,662 |
| 2018 | 44,751 |
| 2019 | 33,029 |
| 2020 | 2 |


