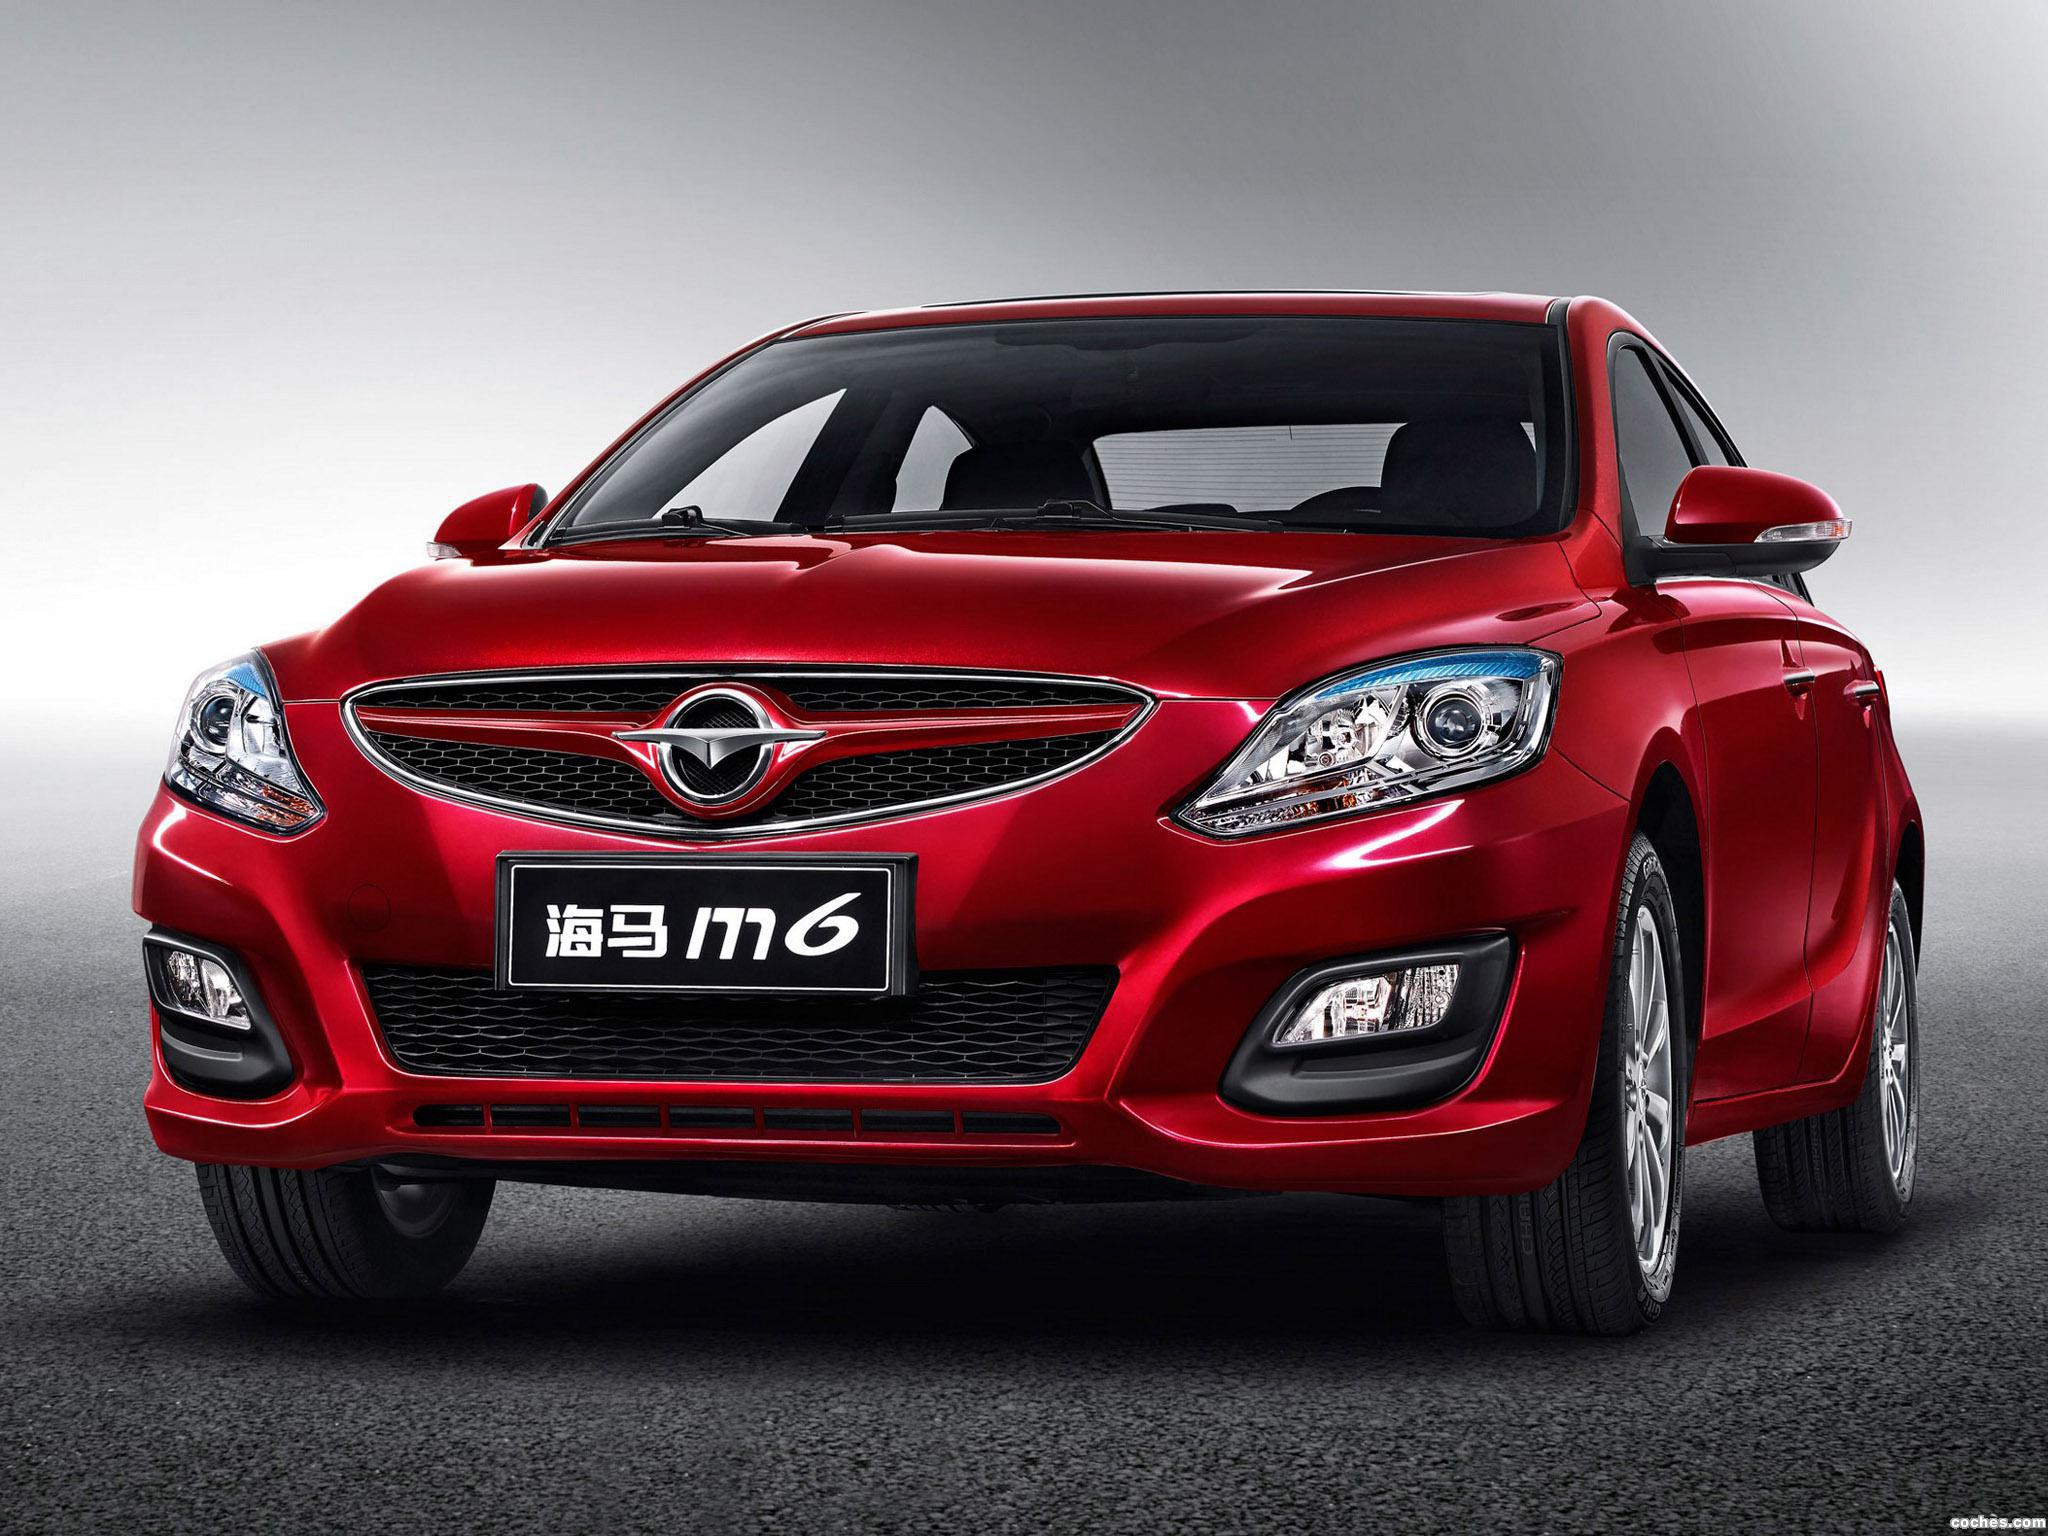
Auto-sales-statistics-China-Haima_M6-sedanSales figures for the Haima M6 in China.


Car sales statistics from China only include domestic production and exclude imported models.


Haima
M6
2016
Haima
M6
2017
Haima
M6
2018
Haima
M6
2019
January 1.118 2.680 377 2
February 611 1.544 110 1
March 815 1.267 216 5
April 1.534 504 811
May 1.148 495 90 7
June 1.225 559 1
July 893 417
August 118 658 1
September 1.184 669 30
October 2.496 623 1
November 2.506 560 4
December 2.370 592 20

Haima
M6
2019 16
2018 1.660
2017 10.568
2016 16.018
2015 11.040


Sources: Manufacturers, Chooseauto.

Haima
M6
2016
Haima
M6
2017
Haima
M6
2018
Haima
M6
2019
January 1.118 2.680 377 2
February 611 1.544 110 1
March 815 1.267 216 5
April 1.534 504 811
May 1.148 495 90 7
June 1.225 559 1
July 893 417
August 118 658 1
September 1.184 669 30
October 2.496 623 1
November 2.506 560 4
December 2.370 592 20

Haima
M6
2019 16
2018 1.660
2017 10.568
2016 16.018
2015 11.040