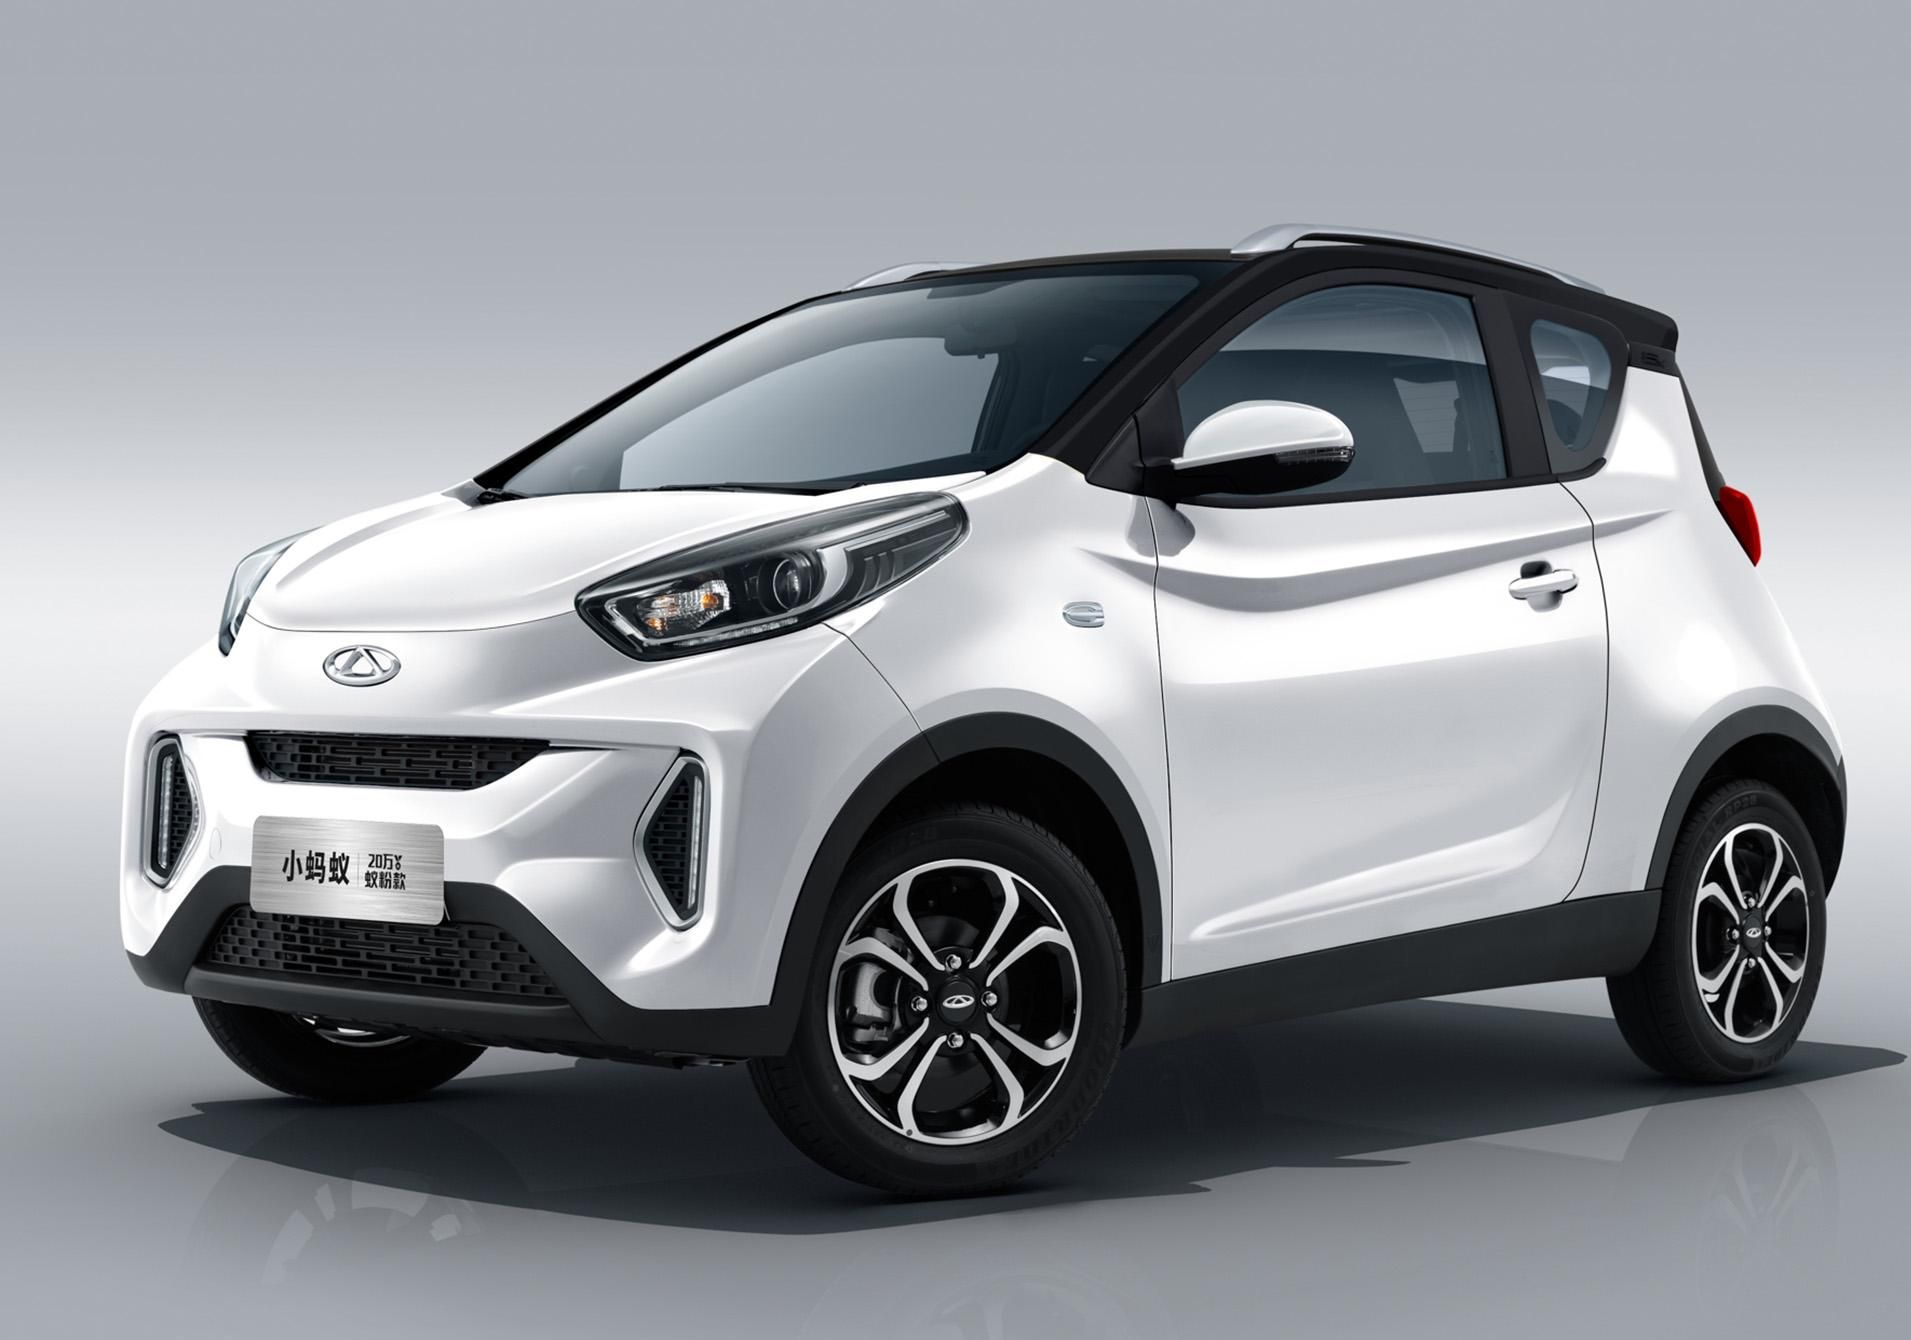
Sales figures for the Chery eQ in China.
Car sales statistics from China only include domestic production and exclude imported models.
CheryeQ2016 |
CheryeQ2017 |
CheryeQ2018 |
CheryeQ2019 |
CheryeQ2020 |
|
January | 390 | 182 | 1.428 | 3.375 | 751 |
February | 571 | 219 | 2.753 | 3.157 | |
March | 636 | 719 | 3.279 | 2.838 | |
April | 1.518 | 1.049 | 3.799 | 4.129 | |
May | 1.269 | 970 | 3.055 | 3.818 | |
June | 953 | 3.466 | 4.434 | 4.965 | |
July | 1.839 | 3.264 | 3.665 | 2.405 | |
August | 1.051 | 2.245 | 4.613 | 2.345 | |
September | 500 | 2.652 | 5.310 | 2.584 | |
October | 2.130 | 1.996 | 5.547 | 2.414 | |
November | 3.233 | 3.372 | 4.352 | 1.861 | |
December | 1.927 | 5.650 | 4.732 | 5.510 |
CheryeQ |
|
2019 | 39.401 |
2018 | 46.967 |
2017 | 25.784 |
2016 | 16.017 |
2015 | 7.262 |
2014 | 542 |
Sources: Manufacturers, Chooseauto.
CheryeQ2016 |
CheryeQ2017 |
CheryeQ2018 |
CheryeQ2019 |
CheryeQ2020 |
|
January | 390 | 182 | 1.428 | 3.375 | 751 |
February | 571 | 219 | 2.753 | 3.157 | |
March | 636 | 719 | 3.279 | 2.838 | |
April | 1.518 | 1.049 | 3.799 | 4.129 | |
May | 1.269 | 970 | 3.055 | 3.818 | |
June | 953 | 3.466 | 4.434 | 4.965 | |
July | 1.839 | 3.264 | 3.665 | 2.405 | |
August | 1.051 | 2.245 | 4.613 | 2.345 | |
September | 500 | 2.652 | 5.310 | 2.584 | |
October | 2.130 | 1.996 | 5.547 | 2.414 | |
November | 3.233 | 3.372 | 4.352 | 1.861 | |
December | 1.927 | 5.650 | 4.732 | 5.510 |
CheryeQ |
|
2019 | 39.401 |
2018 | 46.967 |
2017 | 25.784 |
2016 | 16.017 |
2015 | 7.262 |
2014 | 542 |