
Changan Ouliwei Sales Data & Trends
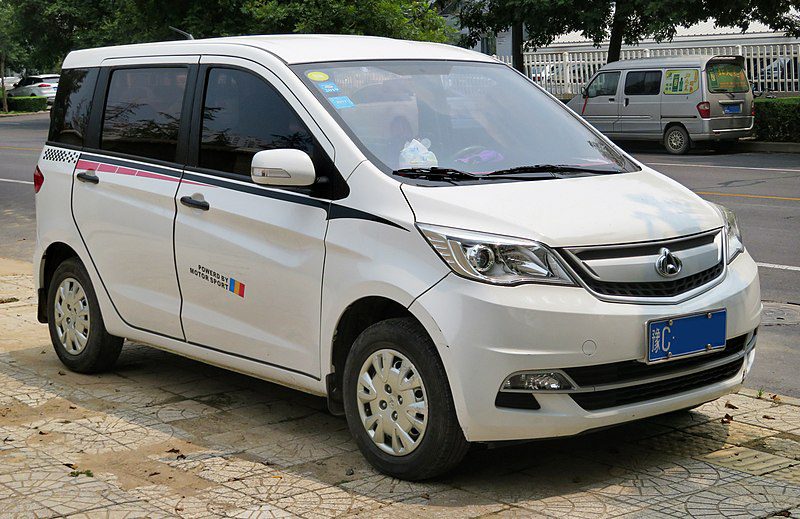
The Chana Eulove or Ouliwei (欧力威) is a Compact MPV produced by Changan Automobile under the Chana brand. The Chana Eulove is a CDV (car-derived van) based on the VOSS concept unveiled at the 2011 Shanghai Auto Show. The Chana Eulove was designed by Changan Automobile’s office in Turin, Italy with a development code of F101. Prices ranges from 39,800 to 65,900 yuan. The production model of the Chana Eulove was debuted in November 2012 at the 2012 Guangzhou Auto Show and hit the market in April 2013. 46,005 units of the Chana Eulove were sold in China in 2014.
Changan Ouliwei China Sales Data & Charts
| Year | Sales |
| 2013 | 22126 |
| 2014 | 46005 |
| 2015 | 37522 |
| 2016 | 7181 |
| 2017 | 5258 |
| 2018 | 2939 |


