2021 Chinese Automotive Sales by Brand – The Best-Selling Automotive Brands By Sales Volume
In 2021 the Chinese passenger car market shows a small improvement on 2020, up 5.7%. The market is almost back at its 2019 level at just over 21 million deliveries, well below the peak of 24.3 million in 2017 but still better than any year before 2016.
 Crossovers and SUVs gain market share with sales up 14.7% to a record 46.4% share, while sedans also outperform the market at +7.1% to lose 1.5 percentage points of share at 48.1% share. Will 2022 become the first year that crossovers outsell sedans in China? They’ve done so three months in 2021: February, April and September. MPVs are the worst performing class of vehicle at +5.5% to drop to 5.5% market share, the lowest since 2012. Within these figures, New Energy vehicle sales grow 158% to nearly 3.52 million for a record market share of 16.7%. This figure includes 2.92 million EVs and about 600,000 PHEVs.
In 2021, local brands have been able to navigate the worldwide supply issues due to the semiconductor shortages much better than the import brands. As a result, they’ve made great progress, while foreign brands are heading in the opposite direction. Domestics see their sales grow by almost a quater at +24.5%, while import brands are down 5.7% on 2020. As a result, Chinese brands take a record 45.2% of their home market, up a massive 6.8 percentage points on last year’s 38.4%. US brands are the only import brands in the black thanks to Tesla, as they’re up as a whole by 9.9%, to hold a market share of 10.3%. Japanese brands outsell European brands in China for hte first time since 2010, thanks to sales down 4.3% which reduces their market share to 21.1%. But European brands are down 10.6% in 2021 to the lowest figure since 2013, and their share drops by 3.8 percentage points to 20.9%. South Korean brands perform the worst, losing over a quater of their volume in China for the second year running. At -25.8% their volume is down to the lowest since 2008 at just 514,000 deliveries. Their market share is at its absolute lowest at 2.4%, less than half of 2018 and just a quarter of 2014.
Brands
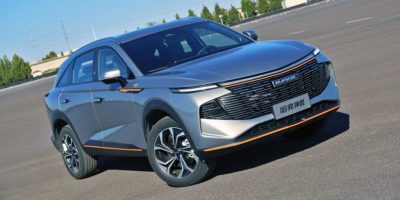
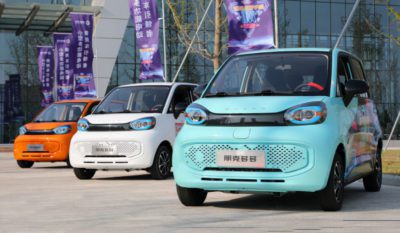
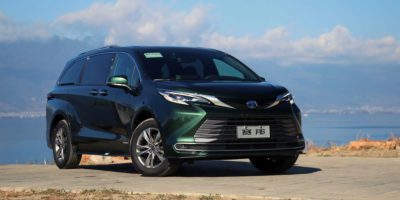 Volkswagen holds on to its top spot, but loses 2.8 percentage points of market share to a record low of 10.3% as sales plummet 17% which makes it the worst performing brand in the top-19. Its 2.16 million deliveries are the lowest since 2012 and is down almost 1 million units from just 2 years ago. Toyota hits both record sales and market share with a 7.7 gain in deliveries, reclaiming the #2 spot from Honda, which is down 6.5% from its high in 2020. Geely celebrates a fifth consecutive year above 1 million sales and the fifth consecutive year as the leading domestic brand, despite sales down 5.5%. Changan is closing in with sales up 15.7% to be back above the 1 million figure for the first time since 2017. Changan last held title of best selling Chinese brand in 2016 when it sold almost double the number of Geely. Nissan and Buick are both down by just under 11% and lose almost a percentage point of market share each. For Buick, this is the lowest market share in China ever. Wuling hits a new annual sales record as the #3 domestic brand on the success of the Hongguang Mini EV and other successful launches. Sales at Wuling more than doubled in 2021, but at the same time Baojun (a Joint Venture between SAIC, Wuling and General Motors) saw its sales cut almost in half to just 221,000, which is down 78% from its 2017 peak. Haval and BYD make it 5 Chinese brands in the top-10, with Haval up 2.6% and BYD up 77.5% to new annual records for both sales and market share. Chery also its a new annual record in sales, up 11.3% in 11th place.
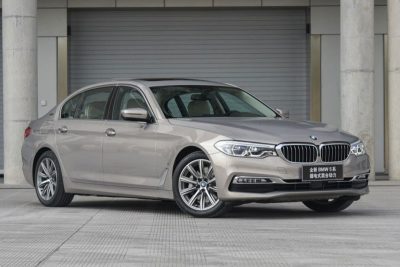 BMW has taken Audi’s long-held title of best selling luxury brand in China for the first time ever. Audi has been producing and selling cars in China since 1988 and has long been the preferred supplier of black sedans for Party members. BMW didn’t start local production until 2004 while Mercedes-Benz only launched made in China cars in 2006 and didn’t hit the 100,000 mark until 2013. In 2021, BMW sales are up 6.5% to a new annual record of 652,000 while Audi sales are down 1.9% from their peak of 2020 to 643,500. Mercedes-Benz is down 6.6% from its peak a year before and loses ground with 598,000 deliveries. Tesla is closing in quickly with a record 473,000 locally produced vehicles, although this figure includes a large number of exports from its Shanghai Gigafactory and doesn’t represent local sales. Local hero Hongqi, which used to sell exclusively to the CCCP but has turned itself into a volume manufacturer of domestic luxury cars and EVs, sets new sales and market shaer records at over 300,000 deliveries.
SAIC MG hits record sales and market share with a 53.5% improvement while sister brand Roewe is down 2.4% at #19. GAC and Dongfeng show nice improvements but are still below their best years. Hyundai is down 18.6% and hits its lowest market share ever at 1.7%. Sister brand Kia also hits its lowest share ever as well as its lowest sales since 2008 at -38.4% in 31st place. Chevrolet dips to its lowest market share ever as well with sales down 13.3%. At least is stays ahead of Ford, down 12.5%. Cadillac is closing in on those two mainstream American brands with a 1.4% gain to a new annual sales record and its third consecutive year above 1% market share. Geely’s Lynk & Co brand (#26, +26.4%), Changan’s Cos brand (#27, +70.8%) and VW’s Jetta brand (#28, +11%), as well as Jetour 9#30, +17.9%) and Great Wall’s Wey (#32, +82.1%) and Ora (#34, +140%) brands all set new records for both sales and market share, and so do EV newcomers Xpeng (#36, +263.5%), Nio (#37, +109.1%), LI Auto (#38, +177.4%), Neta (#42, +323.8%), Leapmotor (#48, +326.1%) and Weltmeister (#49, +96.3%).
 On the other hand, Mazda (#29, -21.9%) has a fourth consecutive year of declining sales and market share and Venucia (#41, -0.7%) hits a new low in deliveries. Skoda (#45, -62.8%), Jeep (#58, -49.9%) and Jaguar (#61, -9.5%) also hit a new lows in sales and share, just when Peugeot (#47, +82.5%) and Citroën (#50, +107.5%) have turned a page and are on the rise again.
Best selling newcomer is Pocco at #51, ahead of FAW’s Voyah brand at #72, Geely’s Zeekr brand at #74, Baizhi at #75 and Skyworth at #81. All are domestic EV brands, unsurprisingly.
We also said goodbye to a number of brands in 2021, most notably Hanteng, Changhe, Leopaard and BAIC’s Huansu brand, while 2021 saw zero sales of domestically produced models from Brilliance, Zotye, Renault, Lifan, Bisu, Huasong, Landwind and Luxgen.
Please note these figures are factory shipments for locally produced models only, they exclude imported cars, which make up only a small portion (around 5%) of sales in China. Locally produced cars which are exported from China are included.
2021 Best Selling Car Brands In China
This data table looks at last month’s total automotive brand volumes in China by brand. We compare Chinese automotive brand sales with last year. With these sales numbers we also calculate a growth rate column so you can better gauge an individual automotive brands sales success in the Canadian market.
2021 Auto Brand Market Share Dynamics in China
This data table looks at total automotive sales and specific brand volumes in China. We compare Chinese automotive brand sales with last year. You can see the market share breakout visually for all the automotive brands selling in China.
2021 vs 2020 Auto Brand Sales in China
This chart simply takes each brand and compares their year to date sales with the year to date sales for the same time last year. Brands where the current bar is lower than the prior year bar have seen declines in sales year on year whereas brands with a larger current bar and lower prior bar are seeing growth in volumes year on year.
2021 Automotive Brand Sales Analysis in China
This chart might seem a little complicated at first but once you understand it is very helpful. First, the size of the area for each brand refers to their market share (i.e size). The bigger the circle the larger the brand in terms of sales volumes (YTD). The position of the circle in the chart along the left axis looks at the year to date growth of that brand. The higher the brand is on the chart, the more year to date growth it is seeing in sales volumes. Along the bottom axis you can see the total volumes shipped by that brand year to date.
Sources: Manufacturers, Chooseauto