
Bisu T5 Sales Data & Trends
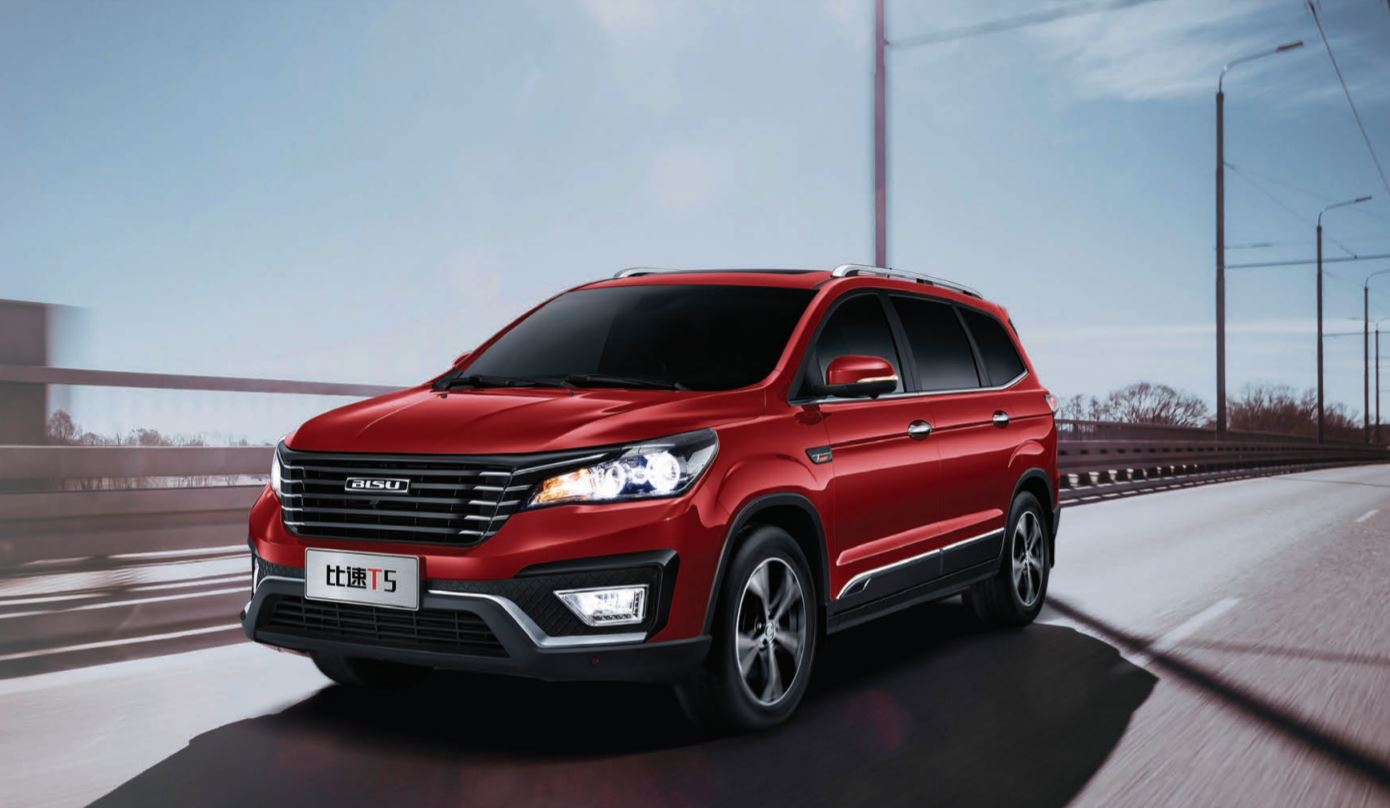
The Bisu T5 is a 7-seat mid-size CUV produced by Bisu Auto, a brand of the Chonqing Bisu Automotive Corporation, which is closely related to Beiqi-Yinxiang, a joint venture between Beijing Auto (Beiqi) and the Yinxiang Group. The Bisu T5 officially debuted during the 2017 Shanghai Auto Show as the third Bisu product following the Bisu M3 and the Bisu T3. The Bisu T5 shares the same platform as the Huansu H5, while the Bisu T5 is a 7-seater crossover MPV, the Huansu H5 is a 6-seater vehicle. Prices of the Bisu T5 ranges from 72,900 to 104,900 yuan at launch. The power of the Bisu T5 comes from a turbocharged 1.5 liter engine with 147 hp, mated to a six-speed manual transmission or a five-speed automatic transmission.
Bisu T5 China Sales Data & Charts
Car sales statistics from China only include domestic production and exclude imported models.
Sources: Manufacturers, Chooseauto.


